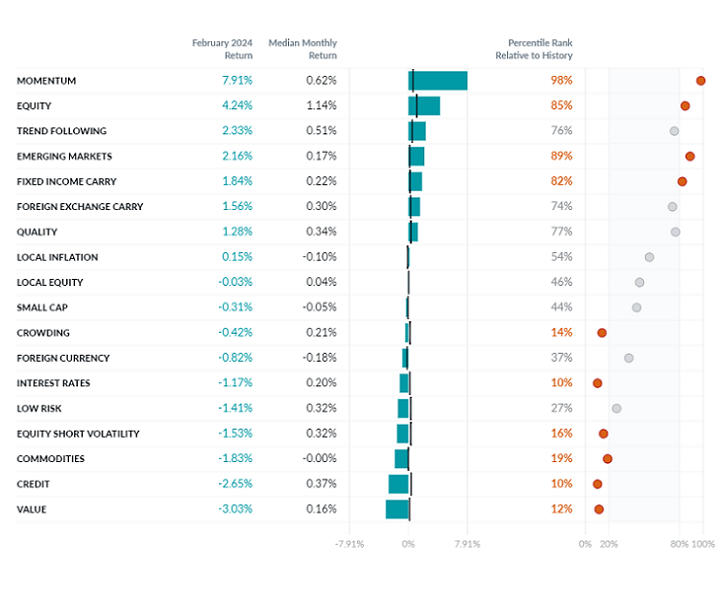
Exhibit 1: February Performance of the Two Sigma Factor Lens

©2024 Two Sigma Investments, LP. This image is for informational purposes only. See https://www.venn.twosigma.com/blog-disclaimer for more disclaimers and disclosures.
Source: Venn by Two Sigma. The median and percentile columns measure the performance of each factor in the Two Sigma Factor Lens relative to the entire history of the factor in USD, using monthly data for the period Oct 1997 - February 2024.
A Look at Single Day Factor Performance
While on the surface, it may seem like this report focuses on only two days of the month, each day represents a shock to prevalent market themes. The first being the recent US CPI print, representing the theme of sticky inflation and higher for longer rates, and the second being NVIDIA’s earnings, which in today’s market, can be examined as an indicator for both AI trends and even equity markets broadly.
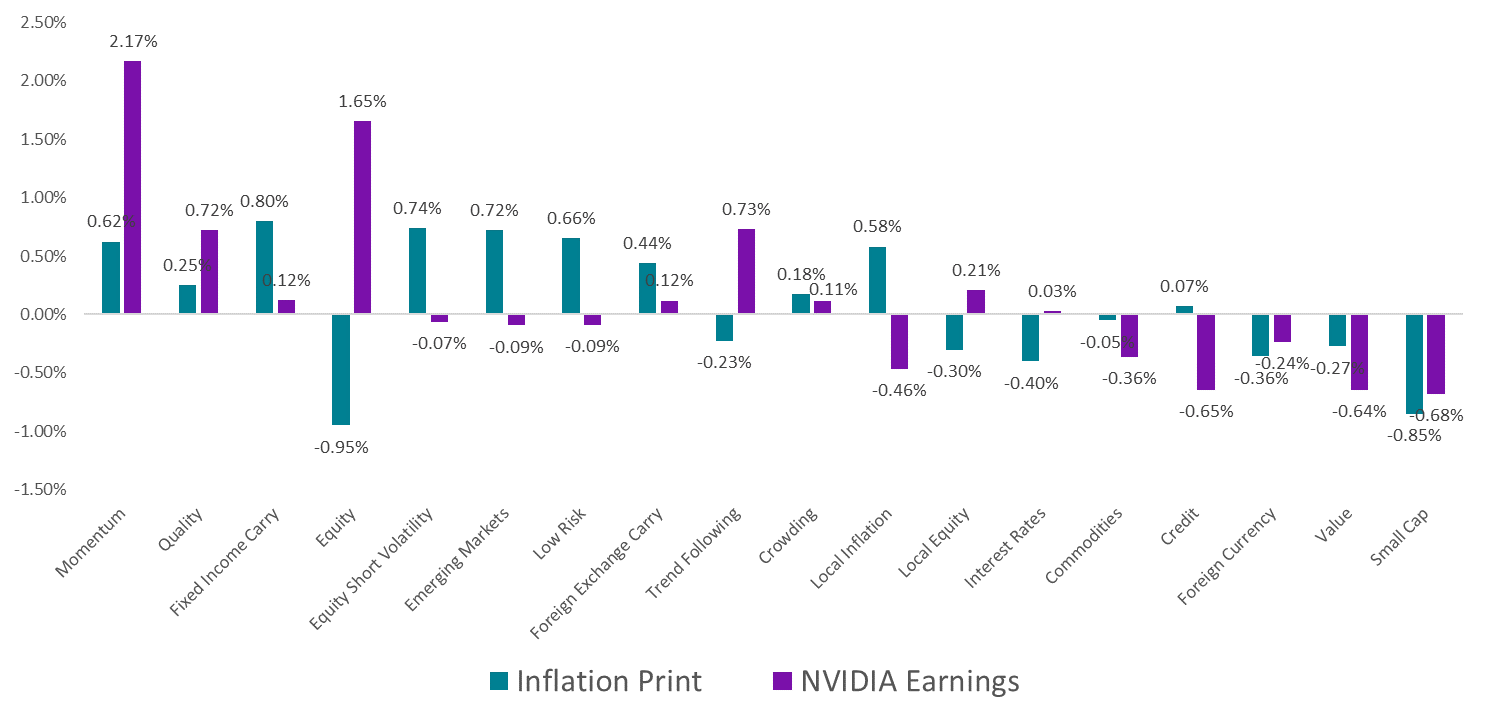
Exhibit 2: Single Day Performance of the Two Sigma Factor Lens

Source: Venn by Two Sigma. Inflation print refers to performance on 2/13/2024, while NVIDIA Earnings refers to performance on 2/22/2024.
Higher than Expected Inflation:
- Equity and Interest Rates continue to respond in the same direction whenever US inflation runs hotter than expected. For example, on the day of the most recent US CPI print, they were down -0.95% and -0.40% respectively. Before the inflation print on 2/13, our Equity factor was up 2.56% for the month, while our Interest Rates factor was down -1.05%.
- Small Cap is the only equity style that is in negative territory since the Fed began fighting inflation in March 2022. This underperformance was again emphasized on the day of the US CPI print, with the factor returning -0.85%.
When isolating periods of higher than 2% YoY CPI, small caps have underperformed large caps when inflation rises further.3 One might interpret rising inflation and higher than expected inflation as similar phenomena, which may explain our Small Cap factor’s underperformance after the US CPI print.
One explanation for underperformance amid higher inflation is the idea that smaller companies may have a more difficult time passing on the higher costs of production to their consumers. Notably, in these high inflation regimes, small caps outperformed when inflation fell.
- Fixed Income Carry’s short basket was well positioned after the US inflation print. More specifically, it benefitted from jumps in yields across US, Canadian, and UK 10-year bonds, which rallied on expectations for higher-for-longer rates in the US. Japanese and Australian 10-year bond yields only slightly increased on the day, limiting losses in the factor’s long basket.
NVIDIA Earnings
While not a recommendation of any security, portfolio, or strategy, the market’s reaction to NVIDIA’s earnings are instructive when viewed through the Two Sigma Factor Lens:
- Momentum has had a strong start to the year, up 15.23% as AI, technology, and higher-for-longer themes have become robust trends in equity markets. On the day after NVIDIA’s earnings, Momentum showed significant sensitivity to the news, rallying 2.17%. Notably, Momentum and Quality are the only equity styles that currently have meaningful net long positions to the tech sector more broadly, a significant driver of performance on this day.
- Value is negatively correlated with both Momentum and Quality over the long term, which in part has to do with typically being net short tech companies like NVIDIA and the tech sector generally. Being short themes such as AI and technology have translated into recent struggles for this factor. It is down -2.09% year to date, and fell -0.64% on the day after NVIDIA’s earnings.
- The Equity factor also rallied on the news of NVIDIA’s earnings, providing further evidence of the weight that market’s have placed on the company’s results. Of course, NVIDIA also makes up 2.78% of investable global market-cap, and was up 16.40% on the day.4 So while many might see NVIDIA’s performance as symbolic for equity markets, there is a strong fundamental connection, as well.
- Trend Following is currently net long equities, benefitting from the broad rally on the day after NVIDIA’s earnings. More specifically, its equity trend following sleeve was up 0.53% on the day.
References
2 More specifically, the headline YoY US CPI was 3.1% versus an expected 2.9%. Core CPI was 3.9% versus 3.7% expected. https://www.barrons.com/livecoverage/cpi-inflation-data-january-report-today
3 https://www.msci.com/www/quick-take/the-ups-and-downs-of-small-caps/04016427937
4 Referenced from the iShares MSCI ACWI ETF (ACWI) as of 2/29/2024
References to the Two Sigma Factor Lens and other Venn methodologies are qualified in their entirety by the applicable documentation on Venn.
This article is not an endorsement by Two Sigma Investor Solutions, LP or any of its affiliates (collectively, “Two Sigma”) of the topics discussed. The views expressed above reflect those of the authors and are not necessarily the views of Two Sigma. This article (i) is only for informational and educational purposes, (ii) is not intended to provide, and should not be relied upon, for investment, accounting, legal or tax advice, and (iii) is not a recommendation as to any portfolio, allocation, strategy or investment. This article is not an offer to sell or the solicitation of an offer to buy any securities or other instruments. This article is current as of the date of issuance (or any earlier date as referenced herein) and is subject to change without notice. The analytics or other services available on Venn change frequently and the content of this article should be expected to become outdated and less accurate over time. Any statements regarding planned or future development efforts for our existing or new products or services are not intended to be a promise or guarantee of future availability of products, services, or features. Such statements merely reflect our current plans. They are not intended to indicate when or how particular features will be offered or at what price. These planned or future development efforts may change without notice. Two Sigma has no obligation to update the article nor does Two Sigma make any express or implied warranties or representations as to its completeness or accuracy. This material uses some trademarks owned by entities other than Two Sigma purely for identification and comment as fair nominative use. That use does not imply any association with or endorsement of the other company by Two Sigma, or vice versa. See the end of the document for other important disclaimers and disclosures. Click here for other important disclaimers and disclosures.
This article may include discussion of investing in virtual currencies. You should be aware that virtual currencies can have unique characteristics from other securities, securities transactions and financial transactions. Virtual currencies prices may be volatile, they may be difficult to price and their liquidity may be dispersed. Virtual currencies may be subject to certain cybersecurity and technology risks. Various intermediaries in the virtual currency markets may be unregulated, and the general regulatory landscape for virtual currencies is uncertain. The identity of virtual currency market participants may be opaque, which may increase the risk of market manipulation and fraud. Fees involved in trading virtual currencies may vary.


