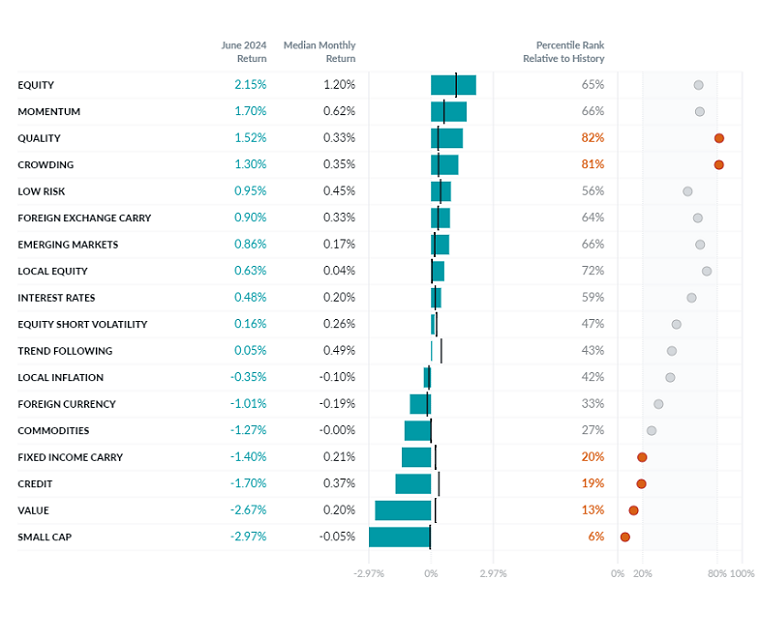
Exhibit 1: June Performance of the Two Sigma Factor Lens
©2024 Two Sigma Investments, LP. This image is for informational purposes only. See https://www.venn.twosigma.com/blog-disclaimer for more disclaimers and disclosures.
Source: Venn by Two Sigma. The median and percentile columns measure the performance of each factor in the Two Sigma Factor Lens relative to the entire history of the factor in USD, using monthly data for the period Oct 1997 - June 2024
In June, four out of six beta-neutral equity styles posted historically significant performance. Quality and Crowding factors achieved positive returns, while Value and Small Cap were negative. On the macro side, both Credit and Fixed Income Carry struggled, posting significantly negative returns compared to their historical performance.
Year to Date Two Sigma Factor Lens Performance: A Focus on Style Factors
The Two Sigma Factor Lens is designed to be holistic, parsimonious, orthogonal, and actionable. While the careful selection and construction of each factor help to achieve these pillars, some factors are associated with return premiums while others are not.
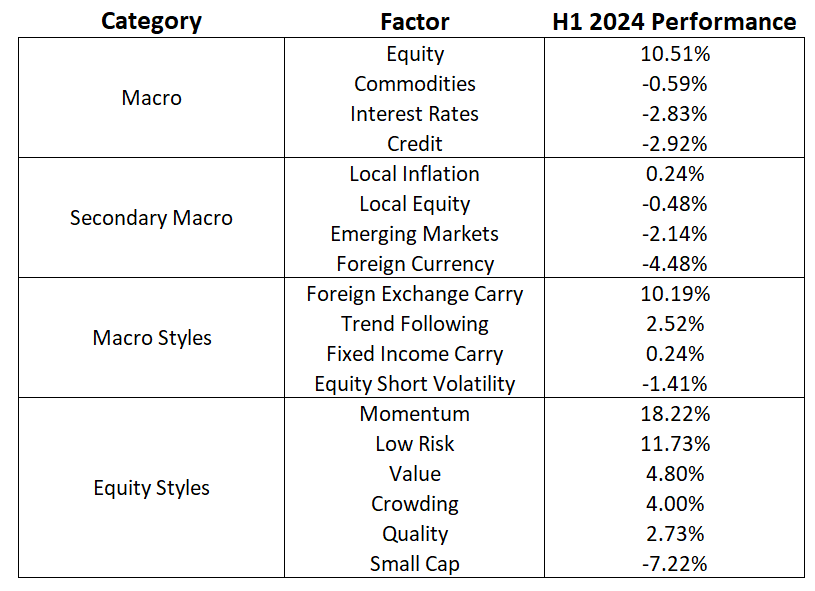
Our style factors, for example, seek to capture known sources of systematic alpha within macro or equity categories, i.e., a return premium. Of our ten style factors, eight were positive in the first half of the year (Exhibit 2). This likely translates into a strong start to the year for institutional alpha seekers, independent of long equity exposure.
Exhibit 2: H1 2024 Two Sigma Factor Lens Performance
Source: Venn by Two Sigma
Macro Styles
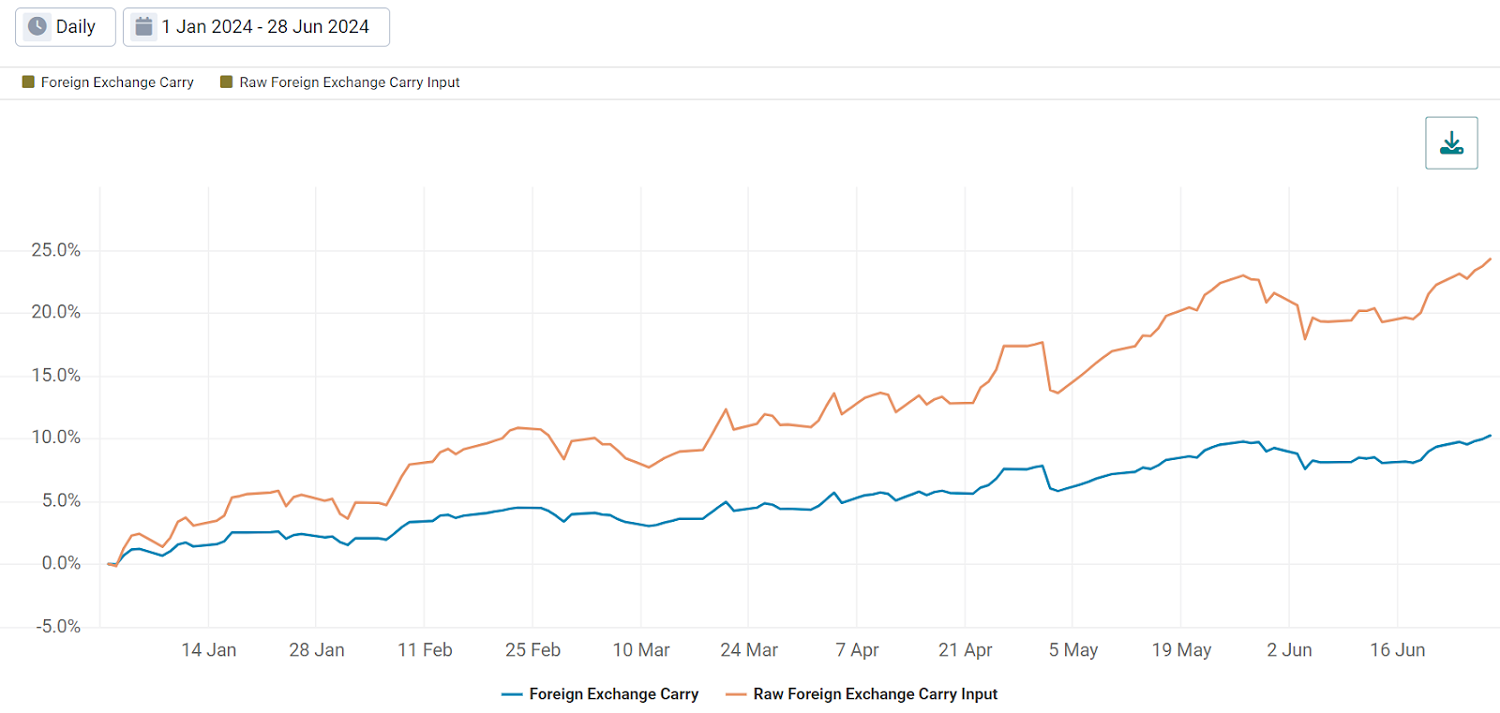
- Foreign Exchange Carry had its second-strongest start to a year, benefiting from widening interest rate differentials and long exposure to higher-yielding currencies, like the USD. The raw input of this factor (before disentangling it from Equity exposure) was up an impressive 24.26%. The orthogonalized 10.19% return aims to represent pure carry and exchange rate dynamics beyond just “risk on” market sentiment.
Exhibit 3: H1 2024 FX Carry Factor Performance
Source: Venn by Two Sigma
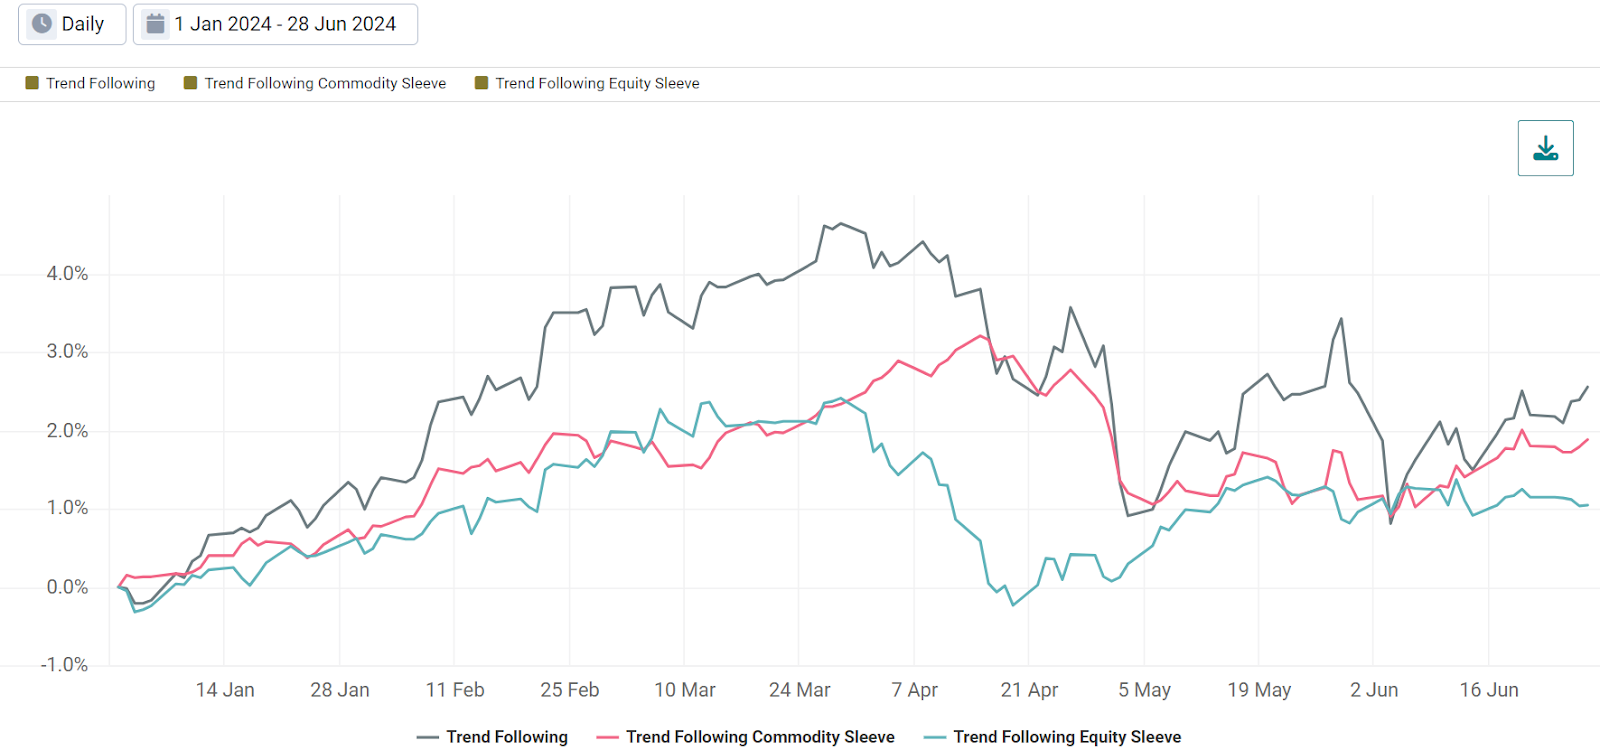
- Trend Following also had a strong start to the year, with positive returns in three out of its four sleeves; fixed income being the lone exception. Notably there were significant drawdowns in the equity and commodity sleeve in April and early May, coinciding with the U.S. inflation report shocking markets.
It’s noteworthy that these sleeves were negatively correlated during this short period. The initial report of higher-than-expected inflation hurt the equity sleeve and benefited the commodity sleeve. The opposite performance dynamic occurred as markets quickly shrugged off these worries and recovered. The broader Trend Following factor has recovered since then, but remains below its highs for the year.
Exhibit 4: H1 2024 Trend Following Factor Performance
Source: Venn by Two Sigma
Equity Styles
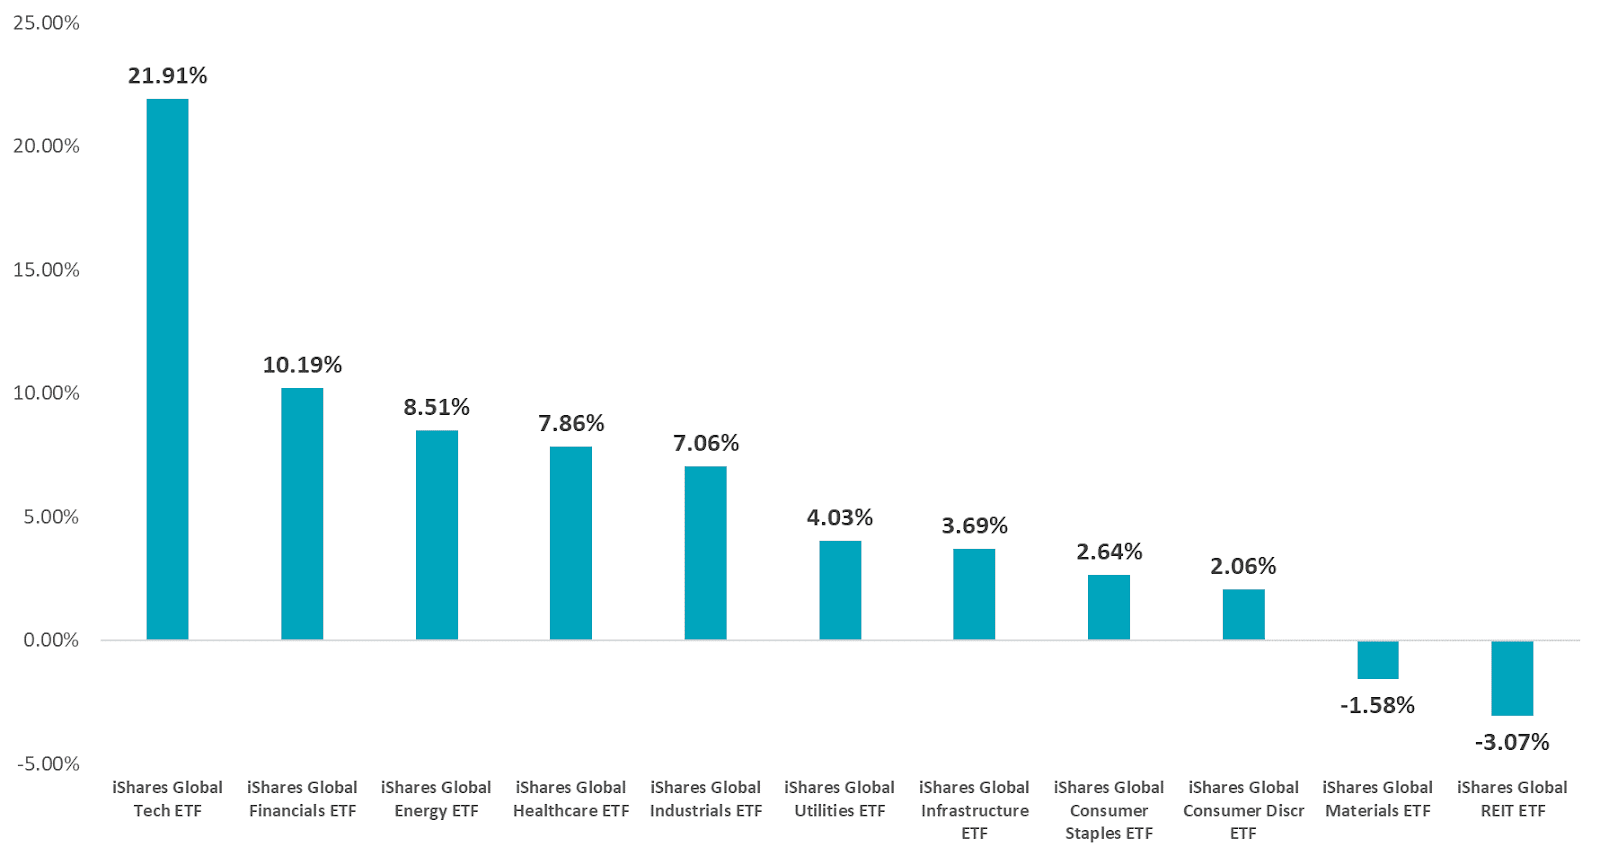
- Similar to FX Carry, this marks the second-strongest start to a year for Momentum. It is probably unsurprising that this factor has benefited from a large net long position in Technology, but there is more to discuss than just NVIDIA and artificial intelligence.
Despite stellar broad equity returns, on average YTD, Momentum has been net short every other sector except Industrials. Unlike Trend Following, the performance of each stock is measured relative to each other, meaning Momentum is guaranteed to short some stocks even if all stocks have been trending positively. Given that most sectors/stocks are positive on an absolute basis, being short does drag on returns, but helps isolate pure Momentum exposure.1
Exhibit 5: H1 2024 Global Sector Performance
Source: Venn by Two Sigma
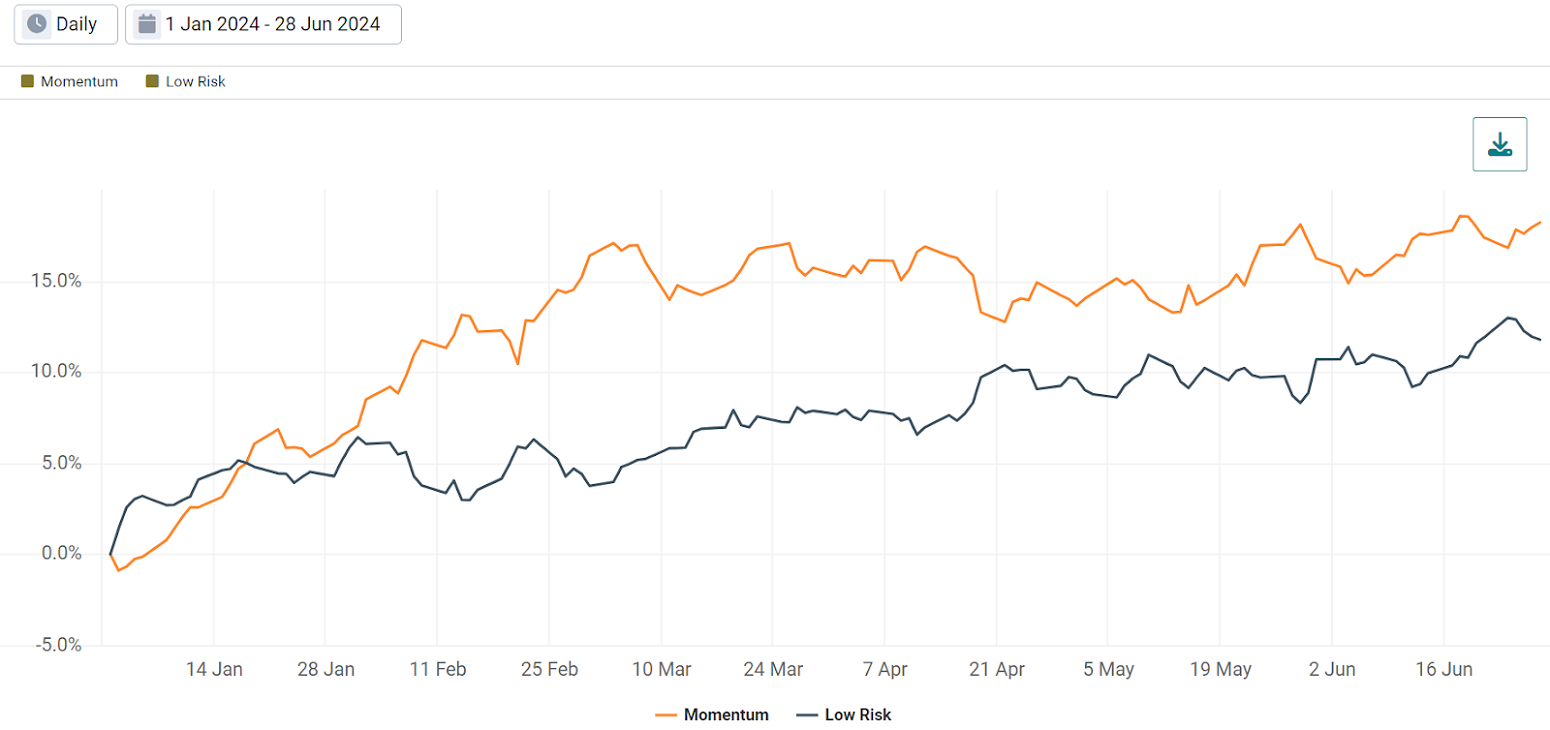
- Low Risk is another factor with strong performance YTD, up almost 12%. Notably, it has had a correlation of -0.55 with Momentum, including its largest net short position being the Technology sector. This stark contrast highlights that there is more opportunity for alpha within equities than just trending Technology or AI stocks. In particular, securities with lower risk have outperformed those with higher risk this year.
Exhibit 6: H1 2024 Momentum and Low Risk Factor Performance
Source: Venn by Two Sigma
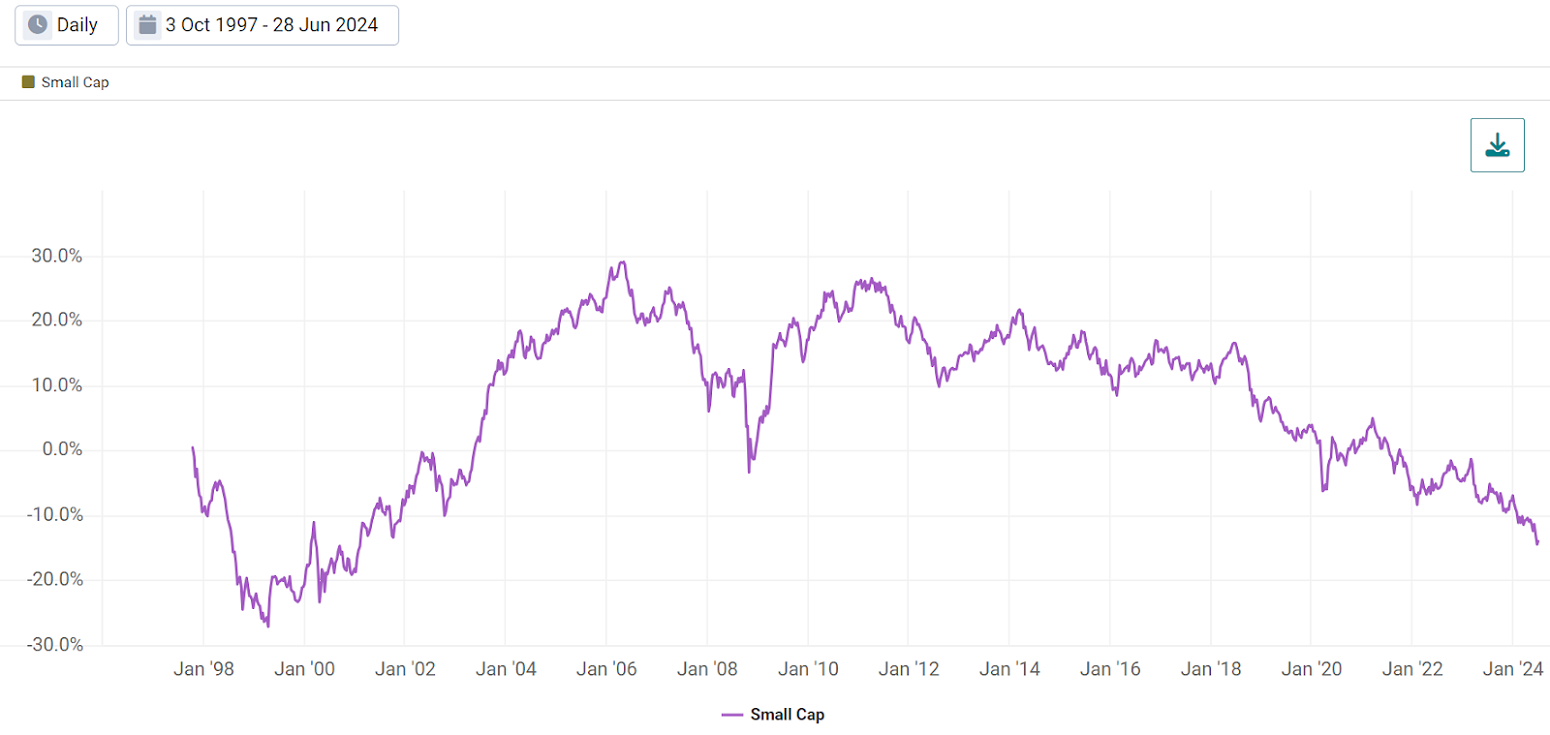
- Despite the title of our report, not all style factors have been positive. Small Cap has continued to struggle in the current market environment. Smaller companies are associated with a positive return premium versus their larger counterparts over full market cycles, but it may be worth raising the question: is this just a mega-cap rally, or is it more of the status quo? Our Small Cap factor has been trending downwards since 2011, with just a few periods of outsized positive performance historically.
Our equity styles are equity beta-neutral. This equalizes the playing field for higher beta small caps relative to lower beta large caps, while also decorrelating it with our Equity factor. A negative historical return premium for our Small Cap factor may imply that the perceived alpha has, in part, been driven by relatively higher equity betas, not necessarily their smaller size. It could also be the case that the opportunity for alpha has diminished as more investors access this style.
While hard to draw a definitive conclusion, it is a question worth raising in an environment where every other equity style seems to be performing well, even those contending with current momentum trends in large cap Technology and AI (Value and Low Risk).
Exhibit 7: Historical Small Cap Factor Performance
Source: Venn by Two Sigma
References
1 Over their full history Momentum and our Equity factor have had virtually zero correlation. YTD in 2024 however, Momentum has exhibited a correlation of 0.28 with our Equity factor.
References to the Two Sigma Factor Lens and other Venn methodologies are qualified in their entirety by the applicable documentation on Venn.
This article is not an endorsement by Two Sigma Investor Solutions, LP or any of its affiliates (collectively, “Two Sigma”) of the topics discussed. The views expressed above reflect those of the authors and are not necessarily the views of Two Sigma. This article (i) is only for informational and educational purposes, (ii) is not intended to provide, and should not be relied upon, for investment, accounting, legal or tax advice, and (iii) is not a recommendation as to any portfolio, allocation, strategy or investment. This article is not an offer to sell or the solicitation of an offer to buy any securities or other instruments. This article is current as of the date of issuance (or any earlier date as referenced herein) and is subject to change without notice. The analytics or other services available on Venn change frequently and the content of this article should be expected to become outdated and less accurate over time. Two Sigma has no obligation to update the article nor does Two Sigma make any express or implied warranties or representations as to its completeness or accuracy. This material uses some trademarks owned by entities other than Two Sigma purely for identification and comment as fair nominative use. That use does not imply any association with or endorsement of the other company by Two Sigma, or vice versa. See the end of the document for other important disclaimers and disclosures. Click here for other important disclaimers and disclosures.


