
Global Factor Performance Commentary
Exhibit 1: Global Factors Cumulative Return Since Inauguration Day
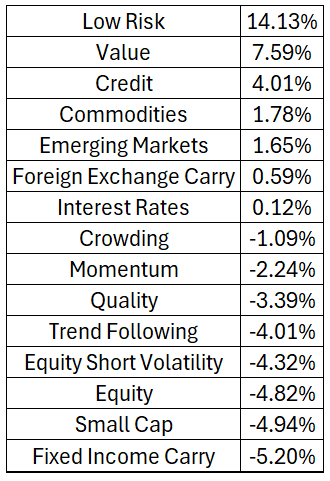 Source: Venn by Two Sigma. Period from 1/20/2025–3/31/2025.
Equity and Interest Rates: Since January 20, Venn’s equity risk premium experienced negative performance, while our interest rates risk premium was roughly flat. These tier 1 core macro factors — which are typically meaningfully positive over long horizons— represent the cornerstones of explanatory power in our factor lens. While much has occurred over this period, less-than-stellar performance was likely driven by U.S. foreign policy, including tariffs. It is worth noting that our Equity and Interest Rates factors tilt toward the U.S. through market-cap weighting. Consequently, concerns over U.S. growth or inflation, stemming from the new administration's policies, meaningfully affect global market exposures.
Our Equity factor shows a clear drop from mid-February to mid-March (Exhibit 2). This captures the height of tariff-related headlines and ensuing market volatility. It is worth noting that our Interest Rates factor did relatively well over this period, and ultimately eked out a positive return through the end of March.
Keep a close eye on mid-February to mid-March in later charts as virtually all factors reacted sharply to this tariff-related volatility.
Exhibit 2: Equity and Interest Rates Factors Cumulative Return Since Inauguration Day
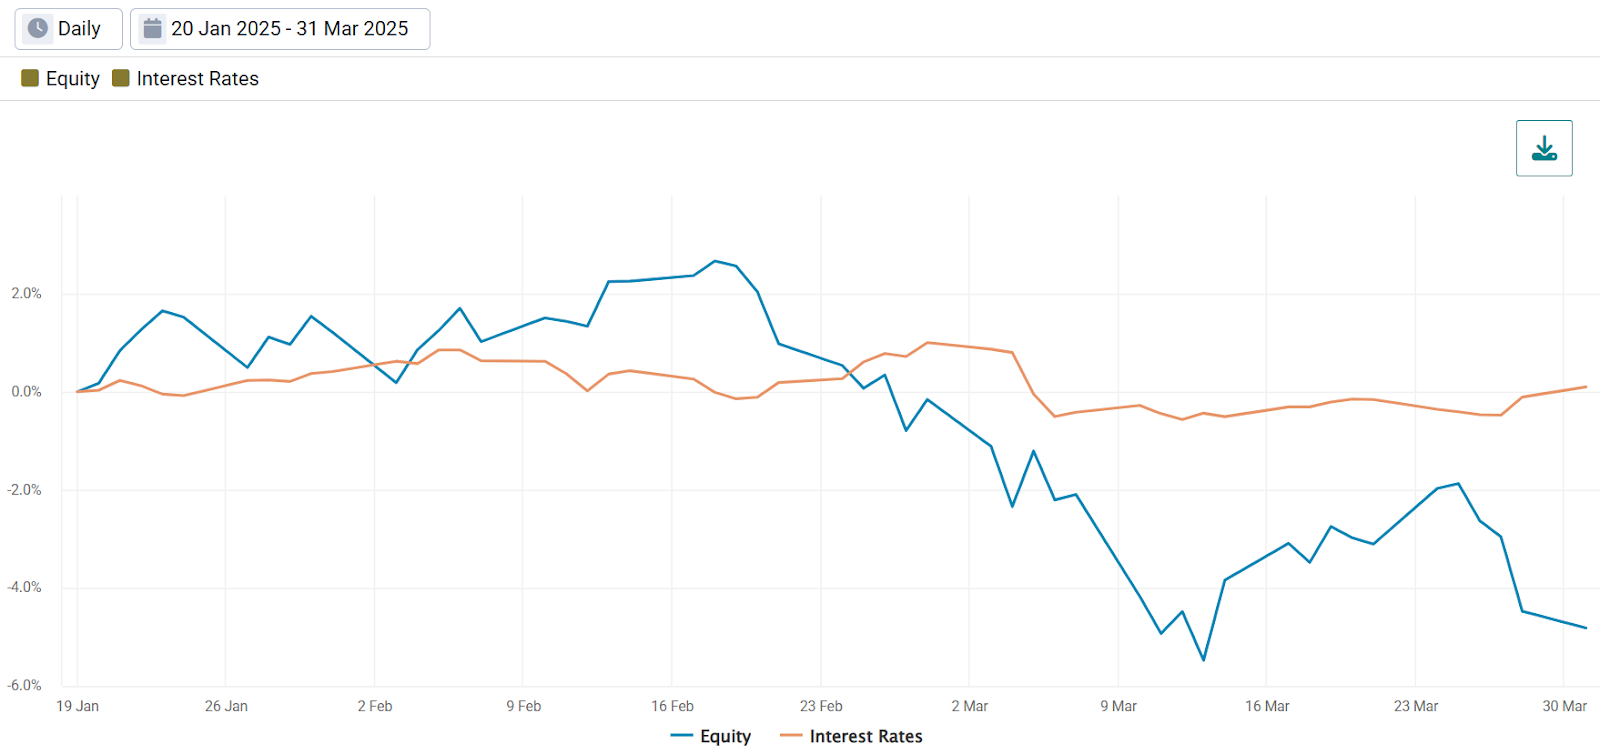
Source: Venn by Two Sigma
Equity Short Volatility and Trend Following: While these factors might not make for a typical pairing, both struggled from a sudden jump in unfamiliar volatility patterns.
Equity Short Volatility fell 4.32% as it typically benefits from low volatility environments. Importantly, Venn’s construction of this factor captures volatility beyond what’s embedded in Equity markets— underscoring the exceptional volatility overflow caused by recent U.S. policies.
Our systematic Trend Following factor relies on consistent and robust trends across equities, commodities, currencies, and fixed income to generate positive performance. Its recent headwinds suggest that pre-inauguration trends have reversed or become fragmented post-inauguration. If the new and recent trends continue, fortunes could change for Trend Following as it is often viewed as a hedge in prolonged periods of market distress.3
Exhibit 3: Equity Short Volatility and Trend Following Factors Cumulative Return Since Inauguration Day
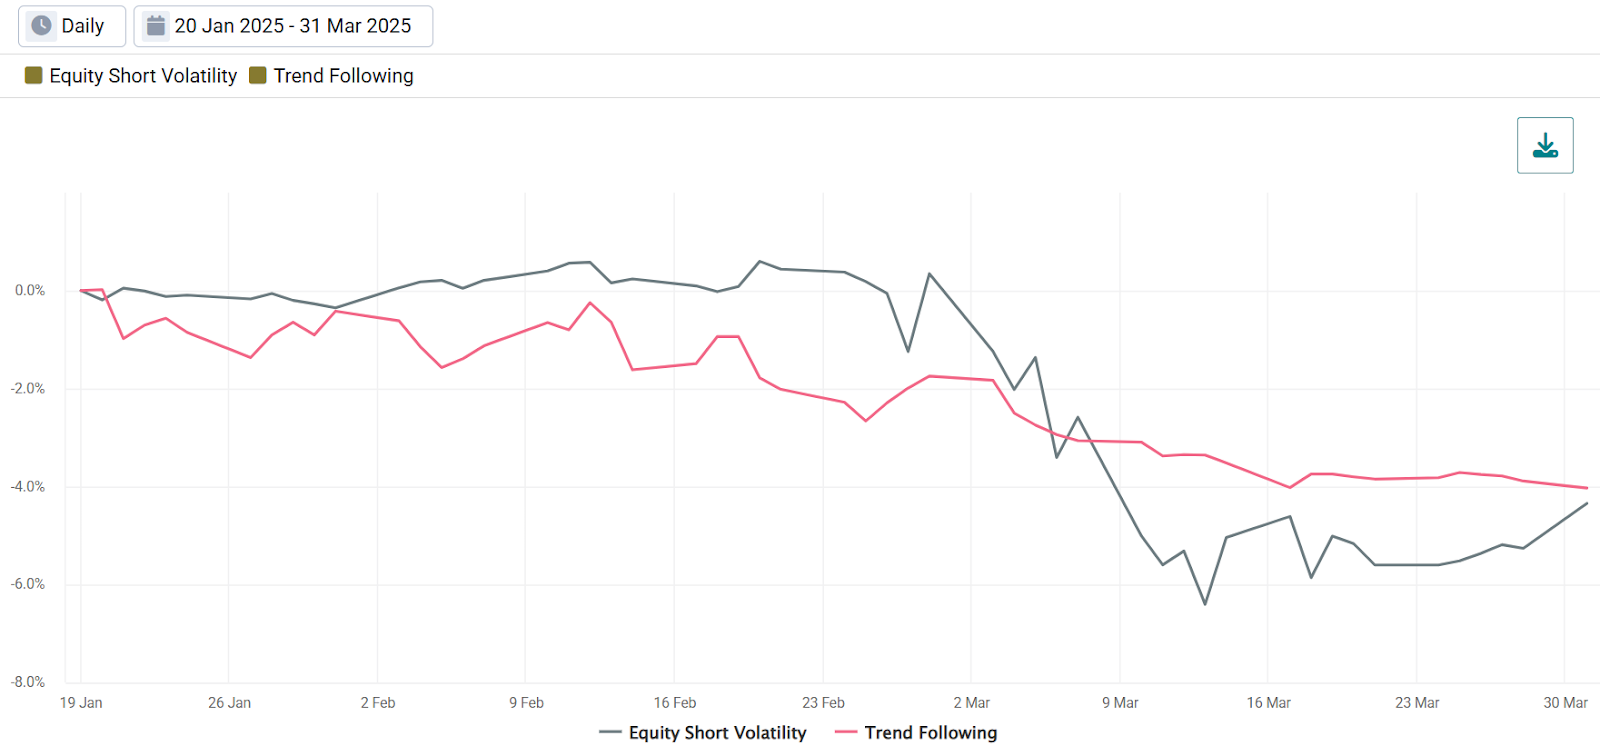
Source: Venn by Two Sigma
Emerging Markets (“EM”): This factor seeks to isolate returns attributed to a pure emerging markets exposure, uncorrelated with our Equity, Interest Rates, Credit, and Commodities factors.
As trade wars and growth scares percolate in the U.S., the potential reallocation of capital from the U.S. to other countries may have benefitted EM. This includes a rally in Chinese equities, driven by attractive valuations, government stimulus, and artificial intelligence tailwinds.4
In Exhibit 4, tariff-related volatility functioned as a catalyst for Emerging Market factor performance — contrasting sharply with the performance of other factors. This pattern strengthens the thesis that emerging markets may benefit from capital reallocation away from U.S. assets.
Exhibit 4: Emerging Markets Factor Cumulative Return
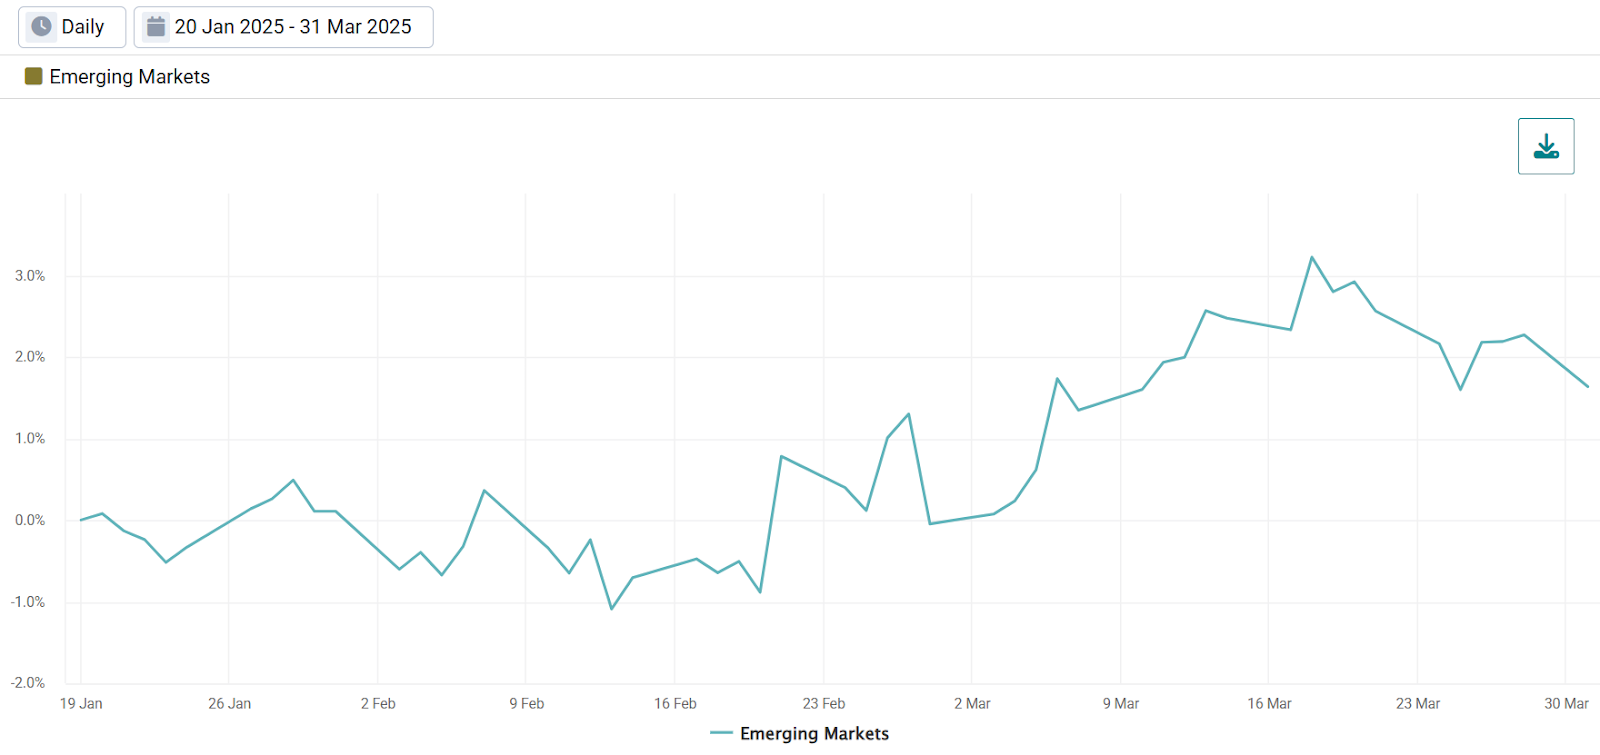
Source: Venn by Two Sigma
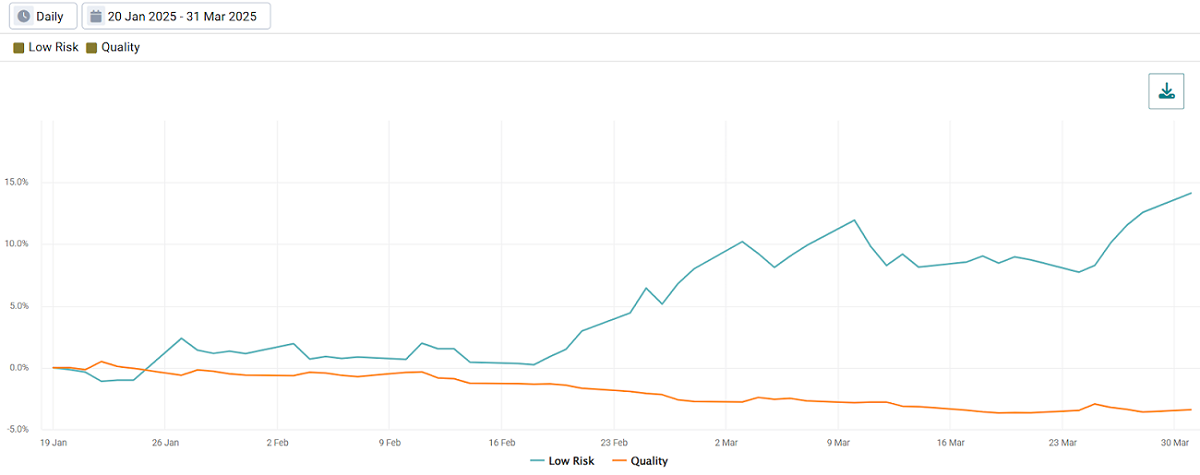
Equity Styles: Low Risk has benefited greatly since U.S. inauguration day, reflecting investors’ preference for lower risk equities in the current environment.
Our Quality factor showed surprising negative performance in a period when a flight to quality might have been expected. One hypothesis is that higher-quality companies— often more mature and with greater reliance on global supply chains— may face heightened exposure to tariff-related disruptions.
Exhibit 5: Low Risk and Quality Factor Cumulative Return Since Inauguration Day
Source: Venn by Two Sigma
Local Factor Performance Commentary
Venn’s local factors change based on an investor’s home currency via different versions of the Two Sigma Factor Lens.5 Comparing the performance of these local factors provides valuable insights for consideration given current market dynamics.
Exhibit 6: Local Factors Cumulative Return Since Inauguration Day
 Source: Venn by Two Sigma. Period from 1/20/2025–3/31/2025.
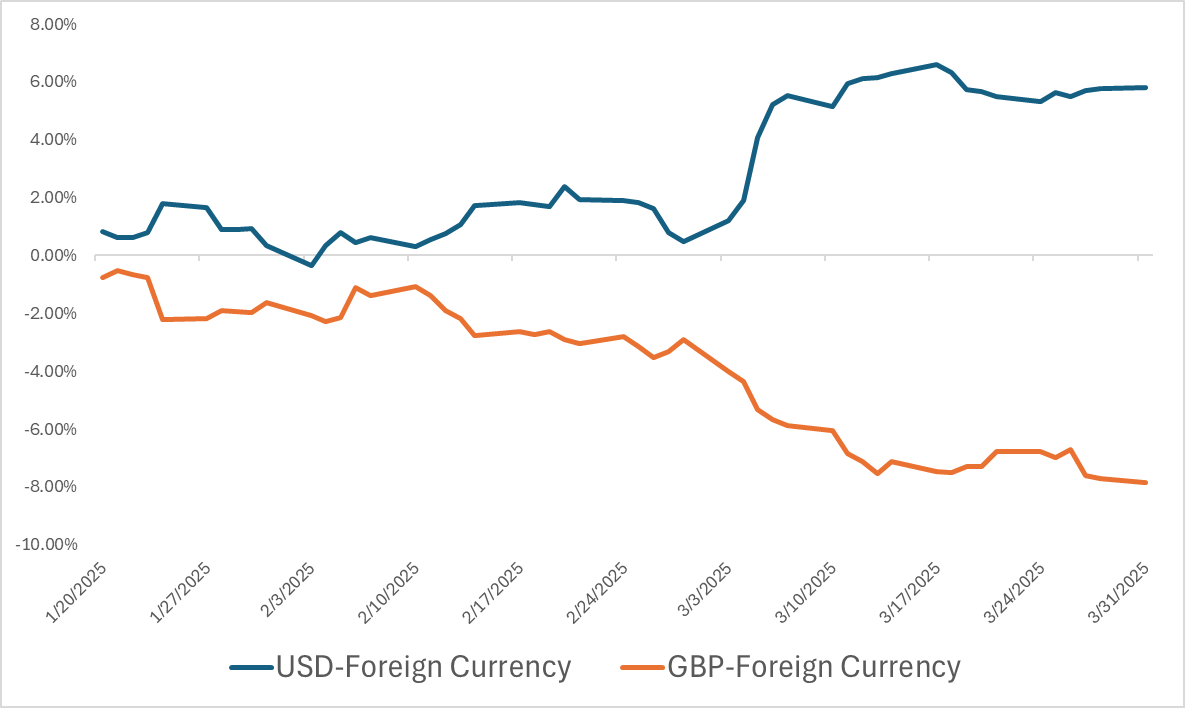
Foreign Currency:
U.S.-Based Investors: Institutional investors with exposure to Venn’s Foreign Currency factor have benefited from USD depreciation since the U.S. inauguration. This weakness likely stems from growth concerns related to trade tensions, spurring diminished demand for the USD and expectations of accelerated rate cuts. While the USD has been weakening throughout 2025, this trend intensified as tariff-related headlines gained momentum around late February.
U.K-Based Investors: Unlike their U.S. counterparts, U.K. investors have faced significant headwinds in international markets due to Foreign Currency factor exposure. One explanation for broad GBP appreciation is the redirection of capital flows away from the U.S., toward economies perceived to have more favorable growth prospects.
Exhibit 6: Foreign Currency Factor Cumulative Return Since Inauguration Day
 Source: Venn by Two Sigma. Period from 1/20/2025–3/31/2025.
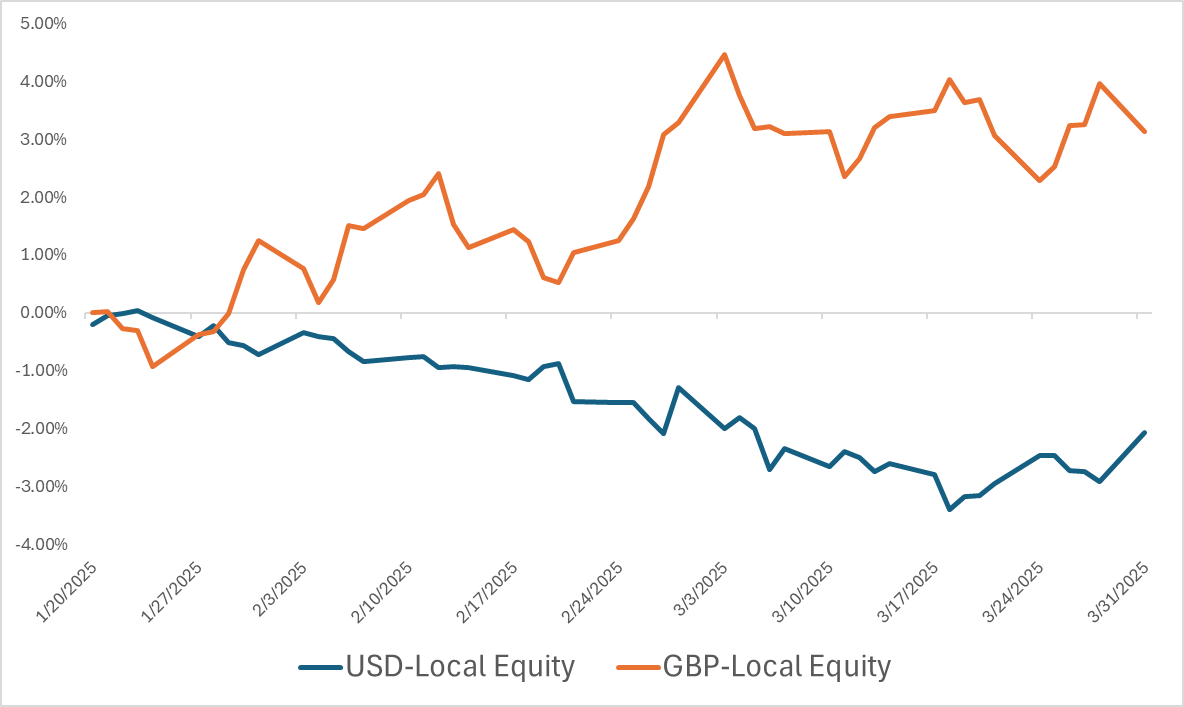
Local Equity:
U.S.-Based Investors: U.S. investors with exposure to U.S.-specific equity market risk experienced headwinds as measured by our Local Equity factor. Including Local Equity as part of a holistic factor analysis helps quantify the impact of popular allocation decisions, such as “home bias.”
U.K.-Based Investors: Despite global markets falling broadly over this period, the unique performance of local U.K. equity markets was positive. This means that those investors exhibiting home bias in their portfolio would have benefited— a stark contrast to their U.S. counterparts. This reinforces the theme that U.S. headwinds may be translating into tailwinds for other regions or countries.
Exhibit 7: Local Equity Factor Cumulative Return Since Inauguration Day
 Source: Venn by Two Sigma. Period from 1/20/2025–3/31/2025.
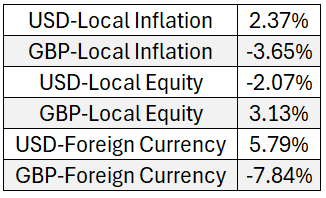
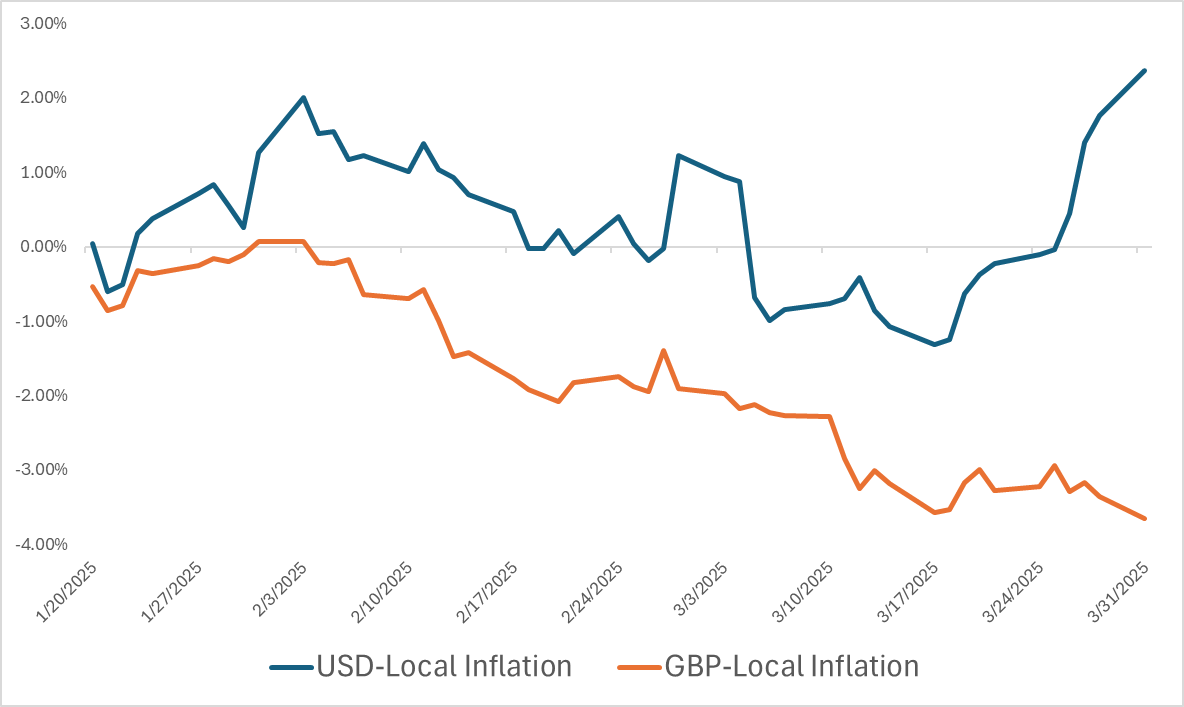
Local Inflation:
Venn’s Local Inflation factor captures the returns specific to a local-currency inflation hedge. This factor is expected to benefit when inflation surprises to the upside, but otherwise tends to lose value due to being short the inflation risk premium in nominal bonds. It captures inflation dynamics beyond those already reflected in our Equity, Interest Rates, Credit, and Commodities factors.
U.S.-Based Investors: Given this factor is typically negative, its positive performance indicates that recent policy shifts have caused an inflation surprise in the U.S. Put another way, a local inflation hedge added value to investors who were implementing it. This was likely due to the perceived impact of tariffs on U.S. supply chains, and the resulting expectations of higher inflation.
This factor experienced most of its gains toward the end of the month, which is somewhat surprising since tariff-related volatility began much earlier. This timing discrepancy, in terms of its positive performance, may indicate that other correlated factors in our lens (that our Local Inflation factor is decorrelated with) efficiently captured market moves due to these headlines at the time.
U.K.-Based Investors: The GBP-Local Inflation factor delivered negative returns, implying that U.K. markets have not been surprised by higher inflation. Thus, local inflation hedges dragged on returns the way they typically would in environments without inflation surprises. Comparing the performance between the GBP and USD versions of this factor highlights how recent tariff policies have manifested in higher inflation concerns in the U.S. but not the U.K.
Exhibit 8: Local Inflation Factor Cumulative Return Since Inauguration Day
 Source: Venn by Two Sigma. Period from 1/20/2025–3/31/2025.
Risk Considerations for U.S. and U.K. Model Portfolios
To highlight potential impacts of U.S. policies on U.S. and U.K. investors, we compared the factor exposures of similar portfolios. Admittedly, the comparability of these portfolios is key to this exercise and more of an art than a science. We stuck to simple allocations and avoided any active managers to keep the comparison as fair as possible. Our two model portfolios represent U.S. or U.K. investors who:
- Maintain an overweight to their local equity market.
- Allocate to the other country's equity market without currency hedging.
- Hold a currency-hedged global bond allocation.
- Include inflation-protected bonds from their local market.
Exhibit 9: Model Portfolio Allocations and Factor Exposure, Trailing 5-Years
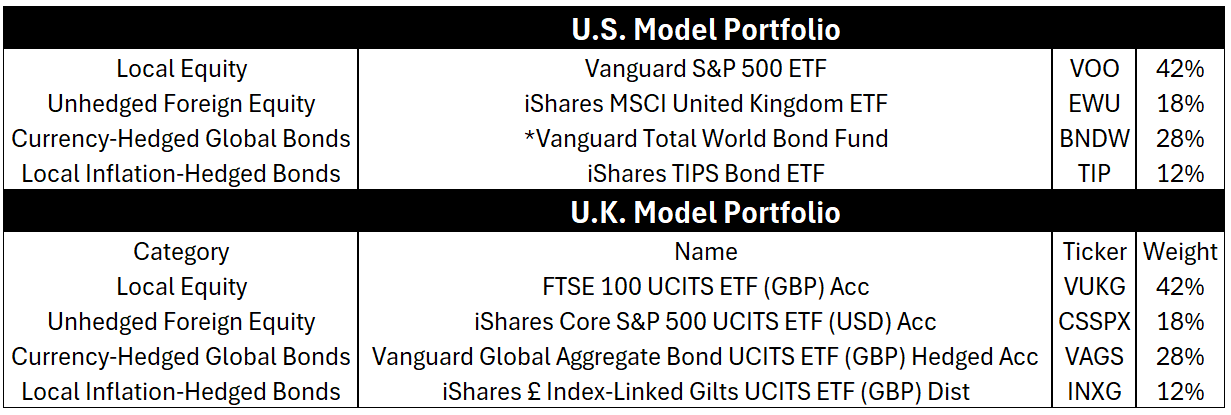 * Note: The Vanguard Total World Bond Fund (BNDW) is currency hedged/invested in USD denominated bonds.
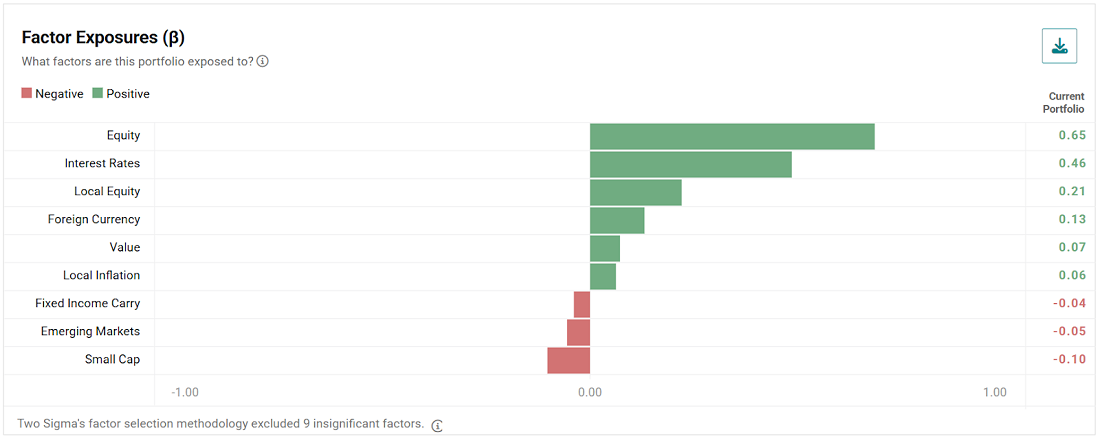
U.S. Model Portfolio Factor Exposure
U.K. Model Portfolio Factor Exposure
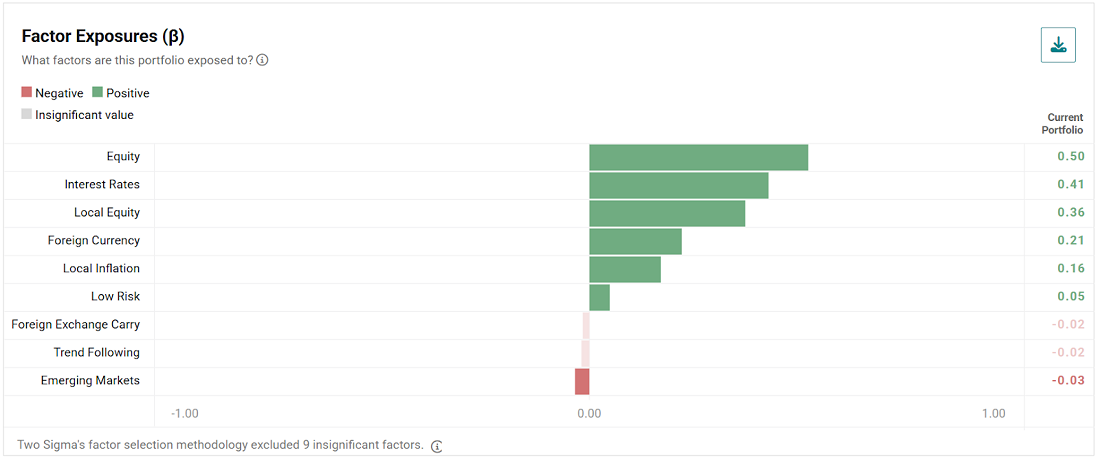
Source: Venn by Two Sigma. Portfolios are rebalanced quarterly over the trailing 5-years.
Factor Exposure Insights
- The U.S.-based model portfolio exhibits higher exposure to our global Equity factor than the U.K version. This suggests more potential vulnerability to a downturn in global economic growth. It also shows a slightly higher exposure to our Interest Rates factor, suggesting relatively more sensitivity to moves in global interest rates. These differences with the U.K. model portfolio are likely due to our earlier comment that our global Equity and Interest Rates factors are inherently tilted to the U.S. through market-cap weighting.
- The U.K-based model portfolio demonstrates higher sensitivity to all three of its local factors: Foreign Currency, Local Equity, and Local Inflation. This suggests that U.K. investors may be inherently more exposed to their local market dynamics than their U.S. counterparts, despite similar allocations.
Pairing Exposure with Factor Performance
- If our Equity factor continues to struggle, U.K. investors may be less exposed to these dynamics than U.S.-based investors— though both model portfolios remain exposed in absolute terms. If local factor trends continue, exhibiting home bias may not be profitable for U.S. investors, while local inflation hedges and Foreign Currency factor exposure may be beneficial.
- U.K. investor’s Local Equity factor exposure has been rewarded since U.S. Inauguration Day, solidifying the benefit a home bias tilt has been, and may continue to be. However, higher than expected inflation has not manifested itself in U.K. markets such that a local inflation hedge, as measured by our Local Inflation factor, has paid off. Additionally, if the GBP continues to strengthen relative to a basket of G10 currencies, Foreign Currency factor exposure may continue to be a headwind for U.K. investors.
Policy-Driven Markets: Leveraging Factor Analysis to Understand Risk
Recent U.S. policy shifts have significantly impacted global fundamental factor risks. Equally important have been the meaningful differences in local factor performance in the U.S. and U.K. These findings underscore the importance of considering how portfolios, managers, or other assets are exposed to both globally and locally-oriented risks, especially in the current environment.
Appendix
March 2025 Two Sigma Factor Lens Performance
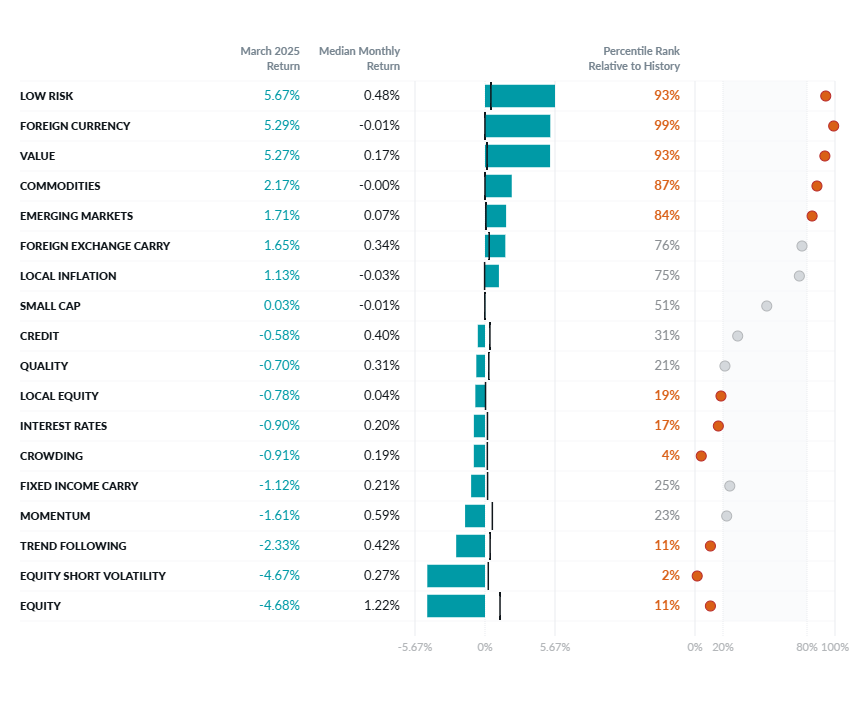
Source: Venn by Two Sigma. The median and percentile columns measure the performance of each factor in the Two Sigma Factor Lens relative to the entire history of the factor in USD, using monthly data for the period August 1998 - March 2025.
©2025 Two Sigma Investments, LP. This image is for informational purposes only. See https://www.venn.twosigma.com/blog-disclaimer for more disclaimers and disclosures.

References
1 Our standard monthly factor performance chart can be found in the appendix.
5 There is a version of the Two Sigma Factor Lens for each currency among the G10.
References to the Two Sigma Factor Lens and other Venn methodologies are qualified in their entirety by the applicable documentation on Venn.
This article is not an endorsement by Two Sigma Investor Solutions, LP or any of its affiliates (collectively, “Two Sigma”) of the topics discussed. The views expressed above reflect those of the authors and are not necessarily the views of Two Sigma. This article (i) is only for informational and educational purposes, (ii) is not intended to provide, and should not be relied upon, for investment, accounting, legal or tax advice, and (iii) is not a recommendation as to any portfolio, allocation, strategy or investment. This article is not an offer to sell or the solicitation of an offer to buy any securities or other instruments. This article is current as of the date of issuance (or any earlier date as referenced herein) and is subject to change without notice. The analytics or other services available on Venn change frequently and the content of this article should be expected to become outdated and less accurate over time. Two Sigma has no obligation to update the article nor does Two Sigma make any express or implied warranties or representations as to its completeness or accuracy. This material uses some trademarks owned by entities other than Two Sigma purely for identification and comment as fair nominative use. That use does not imply any association with or endorsement of the other company by Two Sigma, or vice versa. See the end of the document for other important disclaimers and disclosures. Click here for other important disclaimers and disclosures.