
There are pieces of evergreen investment analysis that are inescapable. For instance, around April each year the “sell in May and go away” articles are bountiful. It can be a struggle to take this adage seriously over market context, but that’s not to say real academic research hasn’t been done to investigate its validity.1 Either way, it’s a predictable topic, and, if nothing else, an entertaining read.
The same is true for the election cycle as authors slice and dice market and political data to provide timely commentary. One may be best served using robust amounts of data to draw meaningful conclusions from political analysis, leaning on academic research, and considering market context more broadly. With that said, we are partaking in what may seem like a bit of “guilty pleasure investment analysis.” We caution that any ties between market performance and political segmentation that we comment on are incomplete without a more robust approach, but we think are informative nonetheless.
Over two decades of data, we applied a political perspective to our Two Sigma Factor Lens to observe how fundamental risk factors performed before and after recent U.S. presidential elections, as well as under different government compositions. To level set, our main goal in this piece is to report our findings with commentary centered around our Tier 1 Equity factor.
Factor Performance Before and After Recent U.S. Presidential Elections
Exhibit 1 shows the cumulative return of our factors six months before and after recent presidential elections since 2000. For this chart (and others), we highlighted the Equity factor in orange, which will be the focus of our commentary. Remember, you can enlarge these images by clicking on them.
Exhibit 1: Two Sigma Factor Lens Cumulative Return Six Months Before and After Presidential Elections
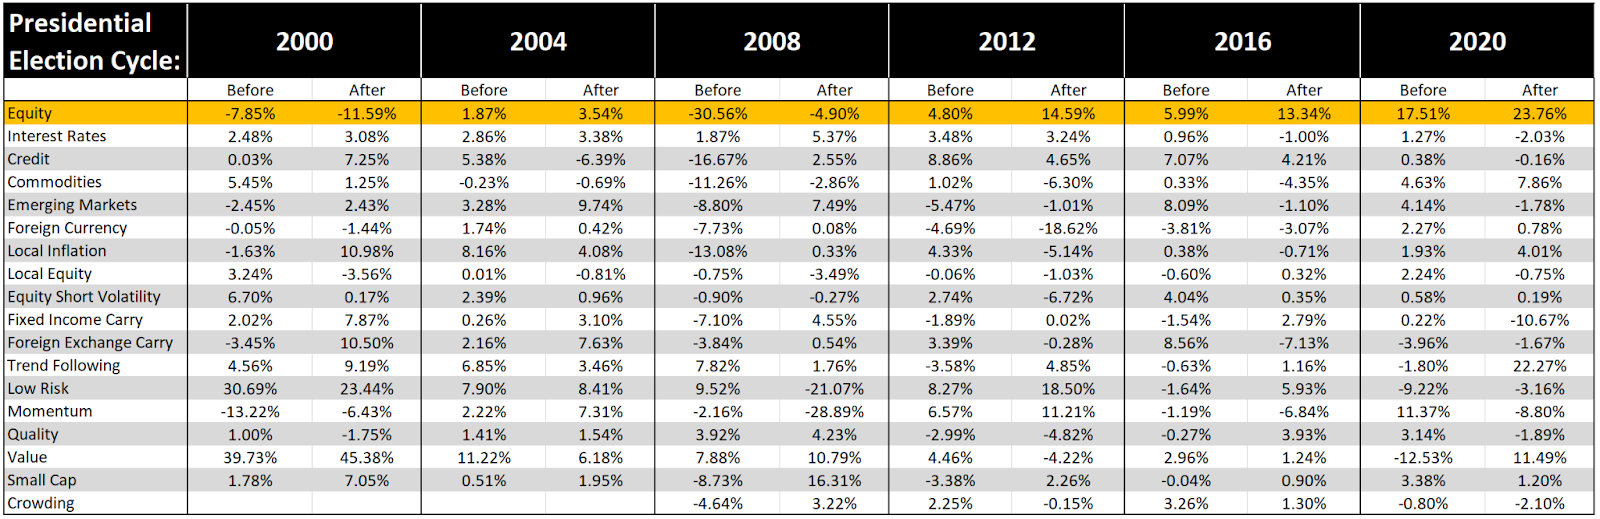
Source: Venn by Two Sigma. “Before” periods: 5/8/2000–11/7/2000, 5/3/2004–11/2/2004, 5/5/2008–11/4/2008, 5/7/2012–11/6/2012, 5/9/2016–11/8/2016, 5/4/2020–11/3/2020. “After” periods: 11/8/2000–5/7/2001, 11/3/2004–5/2/2005, 11/5/2008–5/4/2009, 11/7/2012–5/6/2013, 11/9/2016–5/8/2015, 11/4/2020–5/3/2021.
Acknowledging the importance of market context to interpret this data, we see the 2000 election does stand out. Similar to 2008, this election happened during a recession. With that in mind, the 2000 election was a case where pre-election Equity factor returns were higher rather than afterwards.
Let's gather more data by looking at the same before and after periods, but now observing factor volatility instead (Exhibit 2). (Note that despite being six-month periods, we annualized volatility to make the numbers more familiar).
Exhibit 2: Two Sigma Factor Lens Volatility Six Months Before and After Presidential Elections
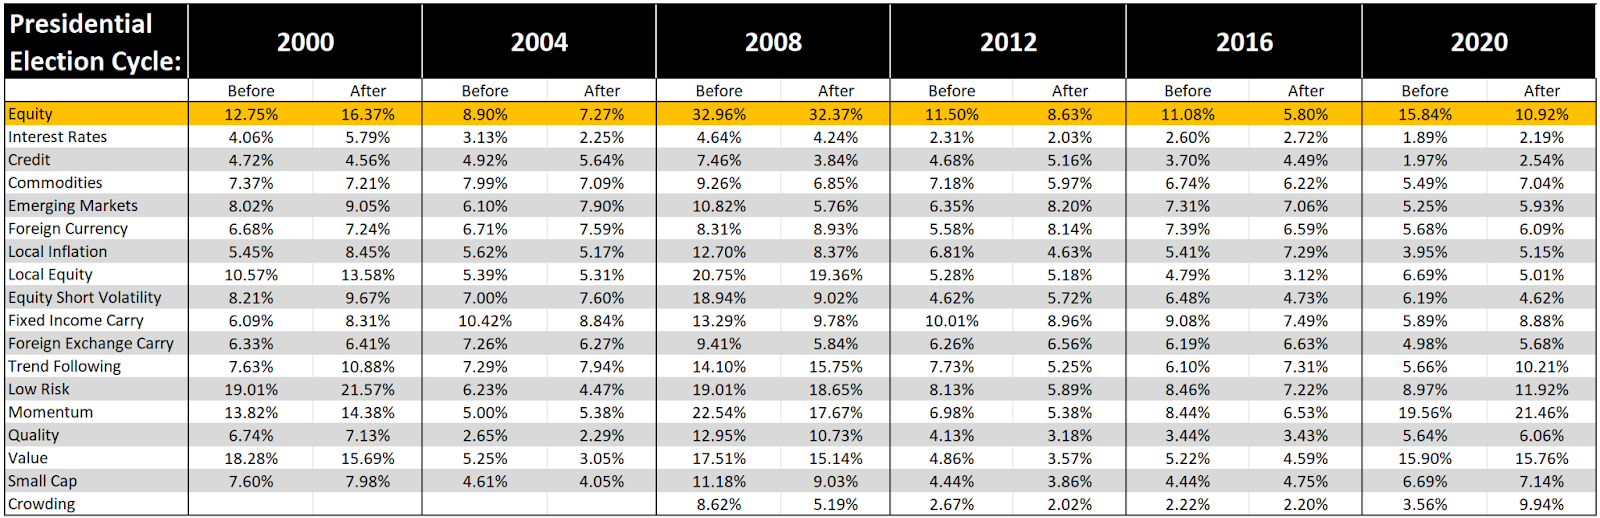
Source: Venn by Two Sigma. “Before” periods: 5/8/2000–11/7/2000, 5/3/2004–11/2/2004, 5/5/2008–11/4/2008, 5/7/2012–11/6/2012, 5/9/2016–11/8/2016, 5/4/2020–11/3/2020. “After” periods: 11/8/2000–5/7/2001, 11/3/2004–5/2/2005, 11/5/2008–5/4/2009, 11/7/2012–5/6/2013, 11/9/2016–5/8/2017, 11/4/2020–5/3/2021.
In Exhibit 2, we show that Equity factor volatility also stood apart in 2000. This was the only period when volatility was lower before the election rather than afterward (though in 2008 there wasn’t much difference).
Was there actually something abnormal going on in politics during the 2000 election, or does this simply reflect business cycle timing?
The 2000 U.S. Presidential Election
The 2000 U.S. presidential election was a landmark event in which results were not decided on Election Day.2 This highly contested election involved a recount of Florida’s votes and was ultimately decided in the Supreme Court. This undoubtedly led to elevated levels of political uncertainty Post-Election Day. While there is no doubt that the economic fundamentals tied to the dot-com bubble burst were already in play, this unique election uncertainty may have exacerbated market volatility and set it on a trend higher than it otherwise might have been.
Common Volatility Trends Around Recent U.S. Presidential Elections
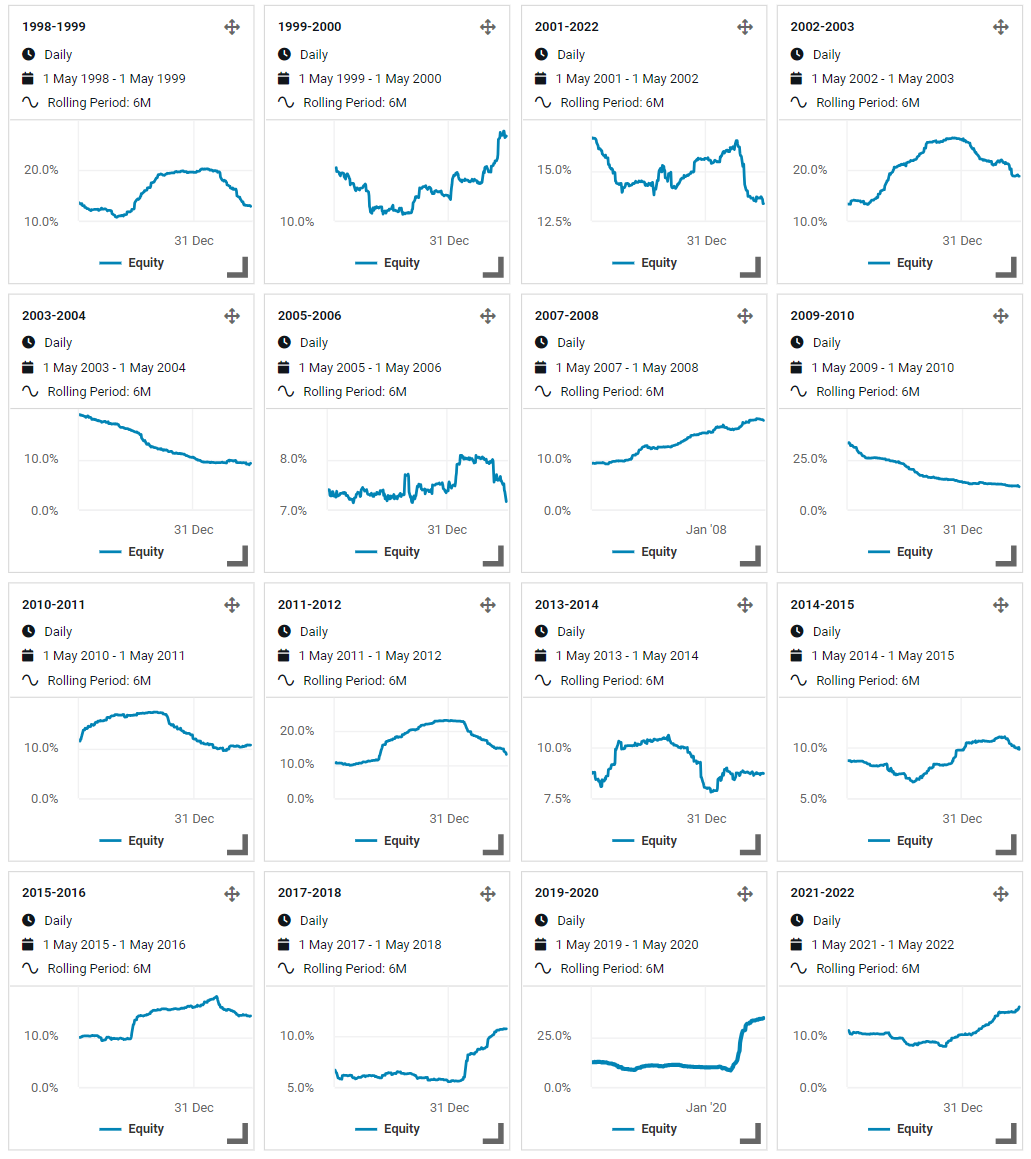
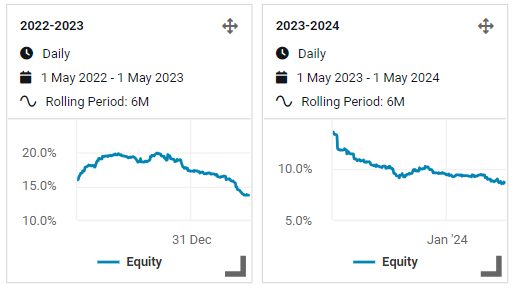
To understand volatility around recent presidential elections further, we used Venn’s Report Lab.3 Exhibit 3 illustrates rolling six-month volatility for the year surrounding each election, encapsulating both the six months before and after. This means that the midpoint area represents Election Day (the black arrow).
Exhibit 3: Rolling Six-Month Volatility Surrounding Recent U.S. Presidential Elections
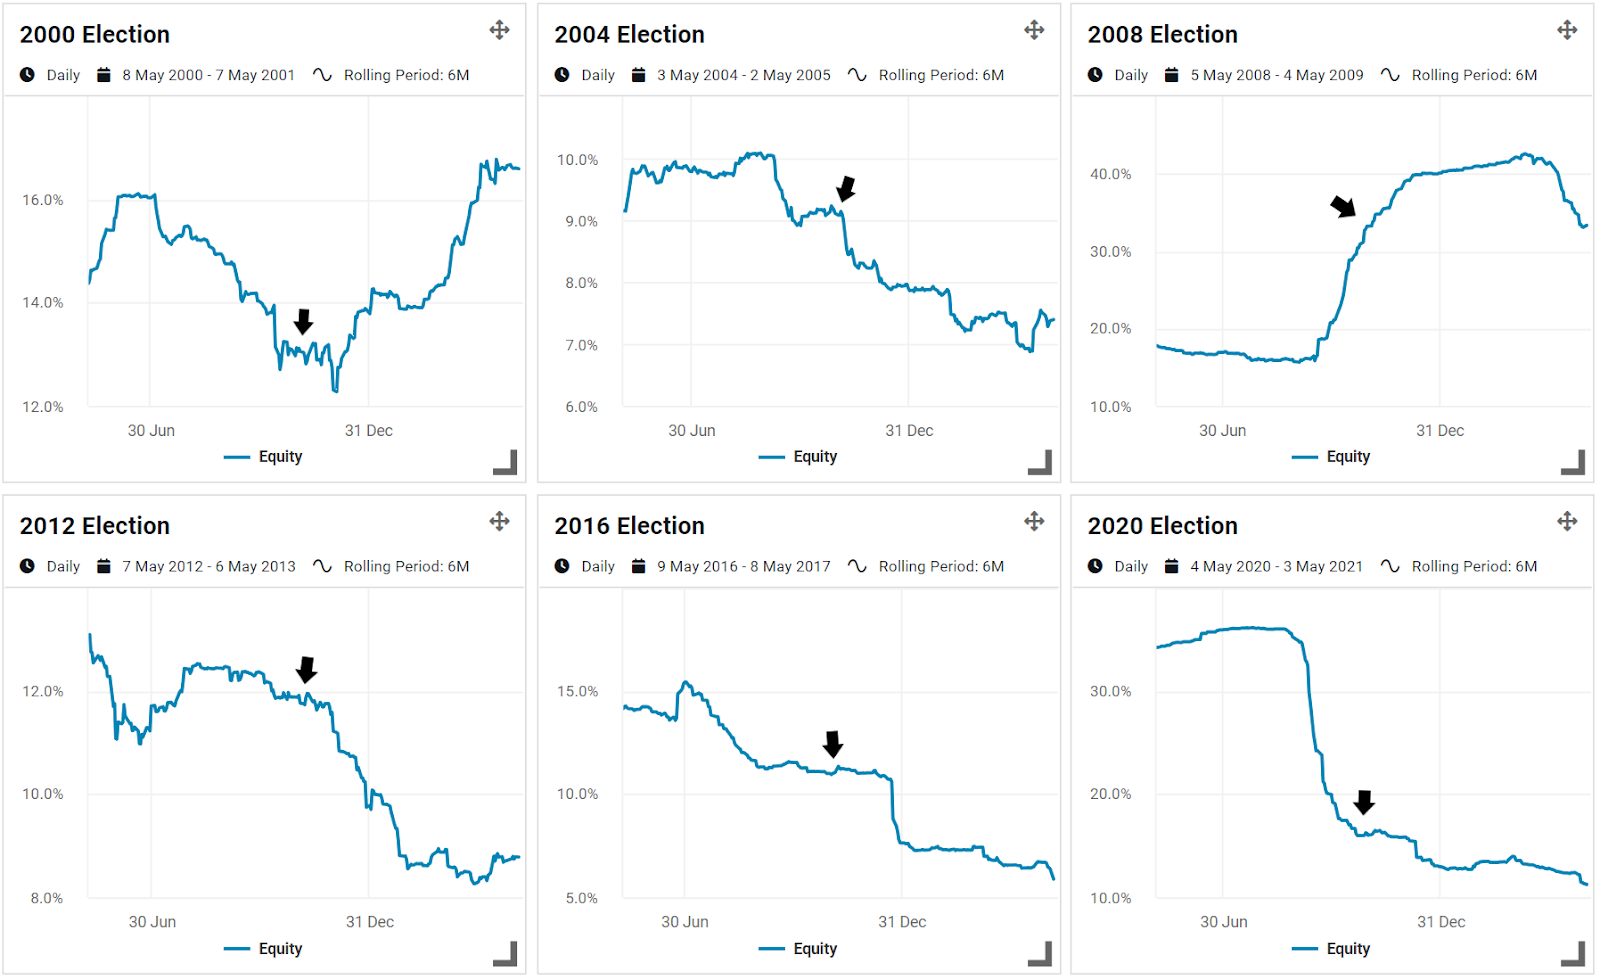
Source: Venn by Two Sigma
Excluding the 2008 election, we observed similar trends in volatility in the first half of each chart: it was relatively high at the beginning of the six-month period leading up to an election, but decreased as Election Day approached. Interestingly, this volatility trend has not been common in non-election years.4
This may seem counterintuitive, as one might expect higher volatility as Election Day nears. However, as an election comes closer, polling and other data likely becomes more reliable, which could reduce uncertainty. Additionally, less time until an election leaves less time for unexpected events to occur, potentially decreasing uncertainty further.
A more likely counter thought is that each year has a reasonable, market-related explanation for volatility patterns, unrelated to politics. 2020 is a good example of this. Markets crashed due to Covid in March, so high volatility was rolling off the six month window by Election Day.
As we saw in Exhibit 2, volatility began trending upwards right after the official 2000 Election Day. This is likely due to both the deepening dot-com recession as well as the added political uncertainty from the Florida recount.
Factor Performance Under Different Government Compositions
Another political perspective one could view factor performance through is different U.S. government compositions. The basic idea is that a unified government would likely pass more policies and better advance its agenda, while a divided government may experience more stagnant politics due to party frictions.
Below we show the median monthly return of our factors over periods of different government compositions, as well as the median monthly return over each factor's full history (in green).5 Remember, you can enlarge images by clicking on them.
Exhibit 4: Two Sigma Factor Lens Performance Under Different Government Compositions
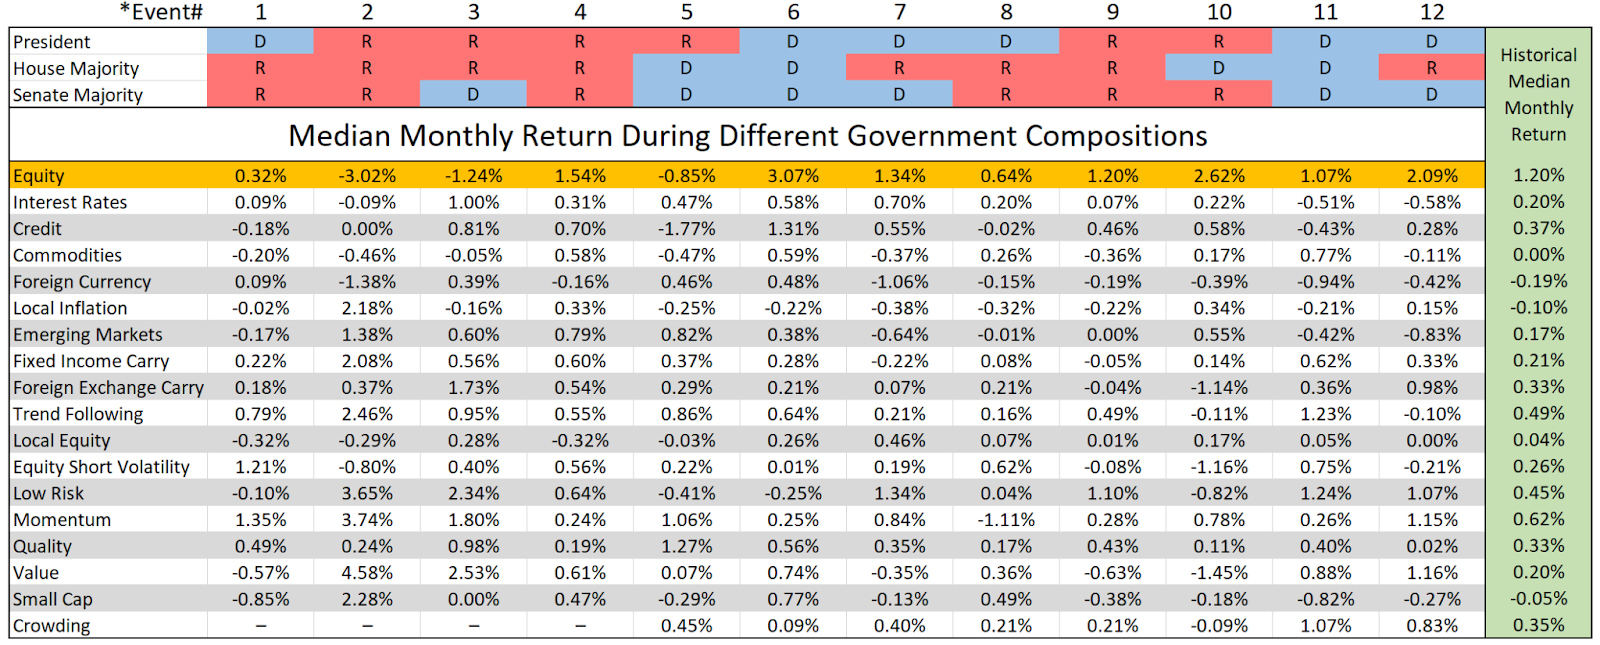
Source: Venn by Two Sigma. *(1) Starting composition of our analysis: 11/1/1997–12/31/2000. (2) George W. Bush becomes president: 2/1/2001–5/31/2001. (3) Senator Jim Jeffords switches from Republican to Independent leading to a Democratic majority in the Senate: 7/1/2001–12/31/2002. (4) Republicans gained control of the Senate after the 2002 midterms: 2/1/2003–12/31/2006. (5) Democrats gained control of the House and Senate after the 2006 midterms: 2/1/2007–12/31/2008. (6) Barack Obama becomes president: 2/1/2009–12/31/2010. (7) Republicans gained control of the House after the 2010 midterms: 2/1/2011–12/31/2014. (8) Republicans gained control of the Senate after the 2014 midterms: 2/1/2017–12/31/2018. (9) Donald Trump becomes president: 2/1/2017–12/31/2018. (10) Democrats gained control of the House after the 2018 midterms: 2/1/2019–12/31/2020. (11) Joe Biden becomes president and democrats gain control of the Senate following the Georgia runoff elections: 2/1/2021–12/31/2022. (12) Republicans gained control of the House following the 2022 midterms: 2/1/2023–6/30/204.
In Exhibit 4, we numbered each period at the top of the chart and labeled them “Event” for easy reference. During the periods we analyzed, our Equity factor achieved its highest monthly median return when there was a unified Democratic government (Event #6), which coincides with the post-global financial crisis period. However, it also achieved a lower return than its historical median during a different unified Democratic government (Event #11), despite still being positive. Its worst median monthly return happened under a unified Republican government (Event #2), but it matched and exceeded its long-term historical median return under different unified Republican governments (Events #4 and #9).
When looking for context regarding our upcoming presidential election, as of this writing the House is a Republican majority while the Senate is Democratic. Assuming no changes in the House or Senate, a presidential victory for Republicans would match the government composition of Event #3 in our table, while a Democratic victory would mirror Event #7 and our current government.
As we have cautioned throughout this piece, it may be wise to put more emphasis on market and economic data alongside any political segmentation analysis. Furthermore, it may be the case that market events precipitate election outcomes. For example, the 2008 election may have ended up as a unified Democratic government because the global financial crisis largely occurred under a Republican president.
Wrapping Up: Political Insights and Factor Performance
There are likely many interesting insights that can be found in this data alongside market context; some meaningful and some not. To this author, the most interesting point that is supported through the specific data and methodology we used is that rolling six month Equity factor volatility has tended to be higher before recent elections rather than afterward, even though it has tended to fall as Election day approaches.
More generally speaking, monitoring factor performance allows investors to look beyond individual headlines to instead collectively interpret world events. We believe the movements of fundamental factors do an excellent job reflecting the landscape of investment risk, political or not, and how portfolios with exposures to factors may be impacted.
Interested in following factor performance? Subscribe to our blog which produces performance reports on a monthly basis.
APPENDIX
Rolling 6-Month Volatility in Non-Election Years
Source: Venn by Two Sigma
References:
1 For example: Bouman, S., & Jacobsen, B. (2002). "The Halloween Indicator, 'Sell in May and Go Away': Another Puzzle." The American Economic Review, 92(5), 1618-1635.
2 https://www.britannica.com/event/United-States-presidential-election-of-2000
3 Venn’s Report Lab module is subject to additional fees.
4 For completeness, we did look at volatility trends of non-election years from May to the following May as well. This data can be seen in the appendix. The goal was to remove seasonal patterns and to see how common higher volatility that trends downward into November was. It seems that of the 18 non-election years that are covered during our analysis, only four exhibited a similar trend in volatility that we found in election years. Because it is rare to see a similar pattern in volatility, this may provide more evidence, even if not decisive, that the pattern of volatility we see in election years may partially be related to the elections themselves.
5 We decided to use median monthly returns for simplicity and to align with our factor performance report. However, transitions between political parties often don’t happen cleanly at month end. Given this, and that the intention of this exercise was not to capture initial market reaction to party changes but rather a more stable understanding of returns over that government composition, we excluded all months when the transition actually takes place. For example, January 2001 is excluded from median monthly return calculations since Bush became president on 1/20/2001.
References to the Two Sigma Factor Lens and other Venn methodologies are qualified in their entirety by the applicable documentation on Venn.
This article is not an endorsement by Two Sigma Investor Solutions, LP or any of its affiliates (collectively, “Two Sigma”) of the topics discussed. The views expressed above reflect those of the authors and are not necessarily the views of Two Sigma. This article (i) is only for informational and educational purposes, (ii) is not intended to provide, and should not be relied upon, for investment, accounting, legal or tax advice, and (iii) is not a recommendation as to any portfolio, allocation, strategy or investment. This article is not an offer to sell or the solicitation of an offer to buy any securities or other instruments. This article is current as of the date of issuance (or any earlier date as referenced herein) and is subject to change without notice. The analytics or other services available on Venn change frequently and the content of this article should be expected to become outdated and less accurate over time. Any statements regarding planned or future development efforts for our existing or new products or services are not intended to be a promise or guarantee of future availability of products, services, or features. Such statements merely reflect our current plans. They are not intended to indicate when or how particular features will be offered or at what price. These planned or future development efforts may change without notice. Two Sigma has no obligation to update the article nor does Two Sigma make any express or implied warranties or representations as to its completeness or accuracy. This material uses some trademarks owned by entities other than Two Sigma purely for identification and comment as fair nominative use. That use does not imply any association with or endorsement of the other company by Two Sigma, or vice versa. See the end of the document for other important disclaimers and disclosures. Click here for other important disclaimers and disclosures.
This article may include discussion of investing in virtual currencies. You should be aware that virtual currencies can have unique characteristics from other securities, securities transactions and financial transactions. Virtual currencies prices may be volatile, they may be difficult to price and their liquidity may be dispersed. Virtual currencies may be subject to certain cybersecurity and technology risks. Various intermediaries in the virtual currency markets may be unregulated, and the general regulatory landscape for virtual currencies is uncertain. The identity of virtual currency market participants may be opaque, which may increase the risk of market manipulation and fraud. Fees involved in trading virtual currencies may vary