
Evaluating a one-car race is... challenging. How can we properly assess its speed or handling without others to compare it to? Sure, you can time it, but if that was always a viable solution, we wouldn’t have races at all.
The investment manager landscape is a competitive one, similar to a fully stocked race. However, just as it wouldn’t be fair to pit a NASCAR driver against an F1 racer, a manager's results should ultimately be contextualized against their industry peers.
Venn’s new peer group analysis (PGA) allows you to evaluate managers against their peers, providing context regarding where they've finished among the pack.
Taking the PGA (Peer Group Analysis) Tour
One downside to our far-from-perfect-race analogy is the weight it puts on a single measurement: time. Of course, investment managers are evaluated along many metrics.
Take, for example, two anonymous managers within the category of US large-cap blend, which represents one of over 500 peer groups that are easily accessible on Venn. In Exhibit 1, we show the return, volatility, Sharpe ratio, max drawdown, and 2019 performance for these anonymous managers among their peer group (click to enlarge the image). The metrics selected for our analysis are by no means exhaustive in terms of the available metrics on Venn.
In all cases, a lower percentile rank would be considered more attractive, meaning we want the manager “dot” to be as high as possible on our chart. For example, Manager 2 captured a return of 14.06%, which equates to a percentile rank of 7. This means that in Exhibit 1, 93% of peers are below their dot, or that Manager 2 outperformed 93% of peers.
Exhibit 1: Anonymous Managers PGA versus US Large-Cap Blend
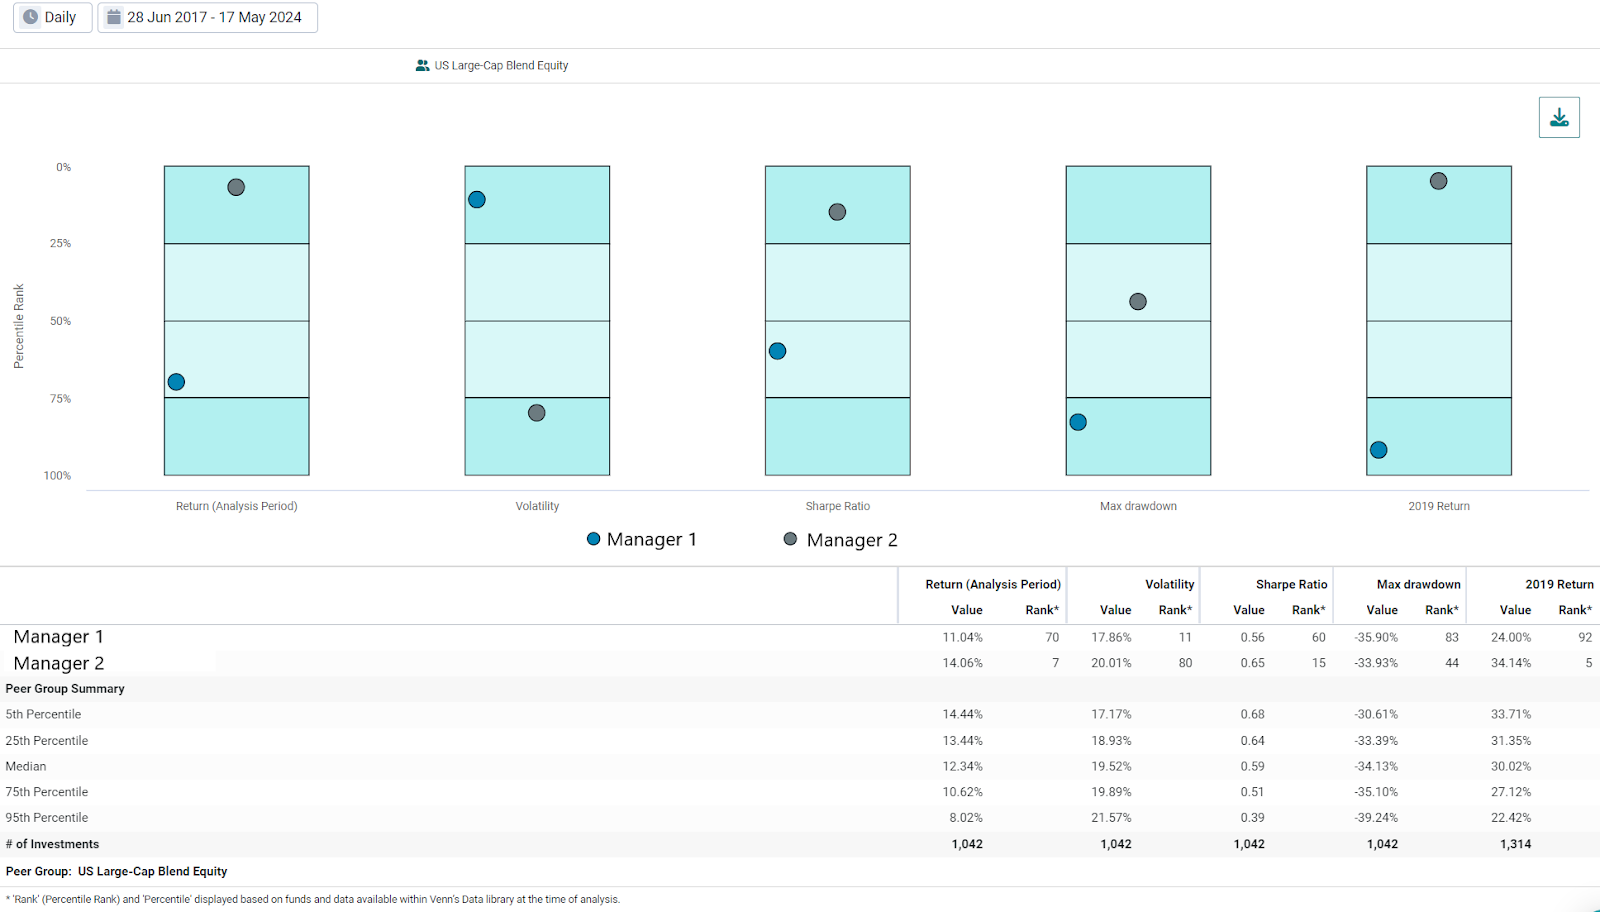
Source: Venn by Two Sigma
From left to right, Manager 1 achieved a below 50th percentile return (below median), while Manager 2 was among the top 10% best performers in the category. While Manager 1 did experience far less volatility (second column), they still ended up with a Sharpe ratio below the median over the period (third column). Despite higher volatility for Manager 2, they achieved an attractive Sharpe ratio in the top 15th percentile of the category.
However, volatility (standard deviation) may not always match how we personally perceive risk. For example, we found that Manager 1, who experienced less volatility, also experienced a deeper maximum drawdown of roughly -36% over this period, worse than 83% of its peers. For investors who may be at risk of deviating from their financial plan when they are losing money, it may be the case that Manager 2 actually has less risk of outsized losses.1
We included the calendar year of 2019 because it is an interesting example of how PGA can provide essential context. Over this year, we found that the 95th percentile was related to a whopping 22.42% total return. Put another way, 95% of large-cap blend managers delivered a return equal to, or better than, 22.42%. In a bunch of one-car races, all of these managers would be considered a winner. However, in a competitive race, we find that greater than 20% returns were simply not enough to be considered strong within US large-cap blend in 2019.
If one wanted to dive deeper into the drivers of this performance, they could conduct Venn’s factor analysis on different managers. There they would likely find that common exposure to economic growth drove many of these managers forward, some more than others.
Relative to Benchmark Peer Group Analysis
Evaluating performance versus a benchmark is a common practice in the investment world. One benefit of Venn is the ability to conduct relative-to-benchmark analysis virtually anywhere in the platform, in just a few clicks. This includes factor analysis, public-market equivalents for private assets, and even PGA, as well. For benchmark-focused investors, this ability allows PGA to be conducted through a familiar lens and enable benchmark specific analyses.
In the case of our US large-cap blend example, a likely benchmark would be the S&P 500. Below we show similar data as Exhibit 1, except now with relative-to-benchmark analysis turned on. As we can see, our statistics are now measured as excess return, tracking error, and information ratio.
Exhibit 2: Anonymous Managers Peer Group Analysis, Relative to Benchmark
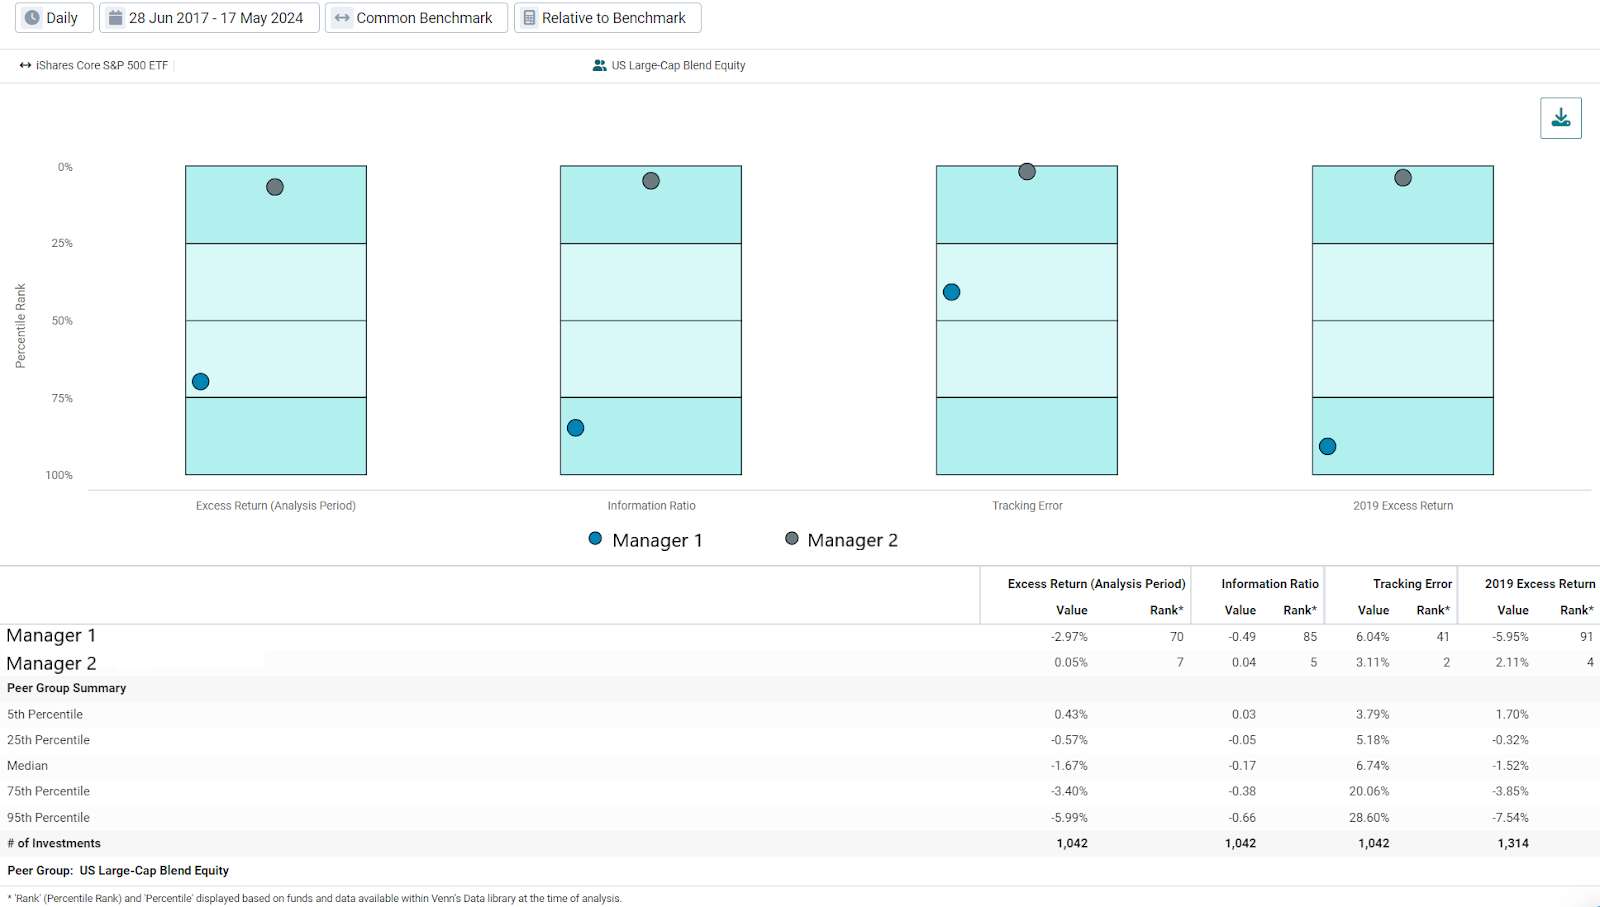
Source: Venn by Two Sigma. S&P 500 represented by the iShares Core S&P 500 ETF (IVV).
While we see that Manager 2 did generally well versus its peers, notice its excess return and information ratio are just barely positive in our table. This shows the potential for PGA to reveal interesting insights about categories broadly, beyond just pinpointing manager ranks.
For example, over this period the excess returns associated with the 5th percentile are just 0.43%, with every other percentile being negative. This means a large majority of US large-cap blend managers in Venn’s data library underperformed the S&P 500 over this period. This may be a result of the largest stocks also being among the best performing (looking at you, NVIDIA), making the market-cap weighted S&P 500 well positioned to benefit.
Racing Towards Context for Manager Evaluation
Venn’s PGA was designed with robust simplicity in mind. Users can select their peer group, metrics, and benchmark with just a few clicks, contextualizing manager performance or risk over their selected period. We believe using peer group analysis leads to more robust manager evaluation, which in turn may lead to more robust multi-asset portfolios.
While we showed a simple use case using US large-cap blend, this analysis can easily be applied to other situations. Evaluating a hedge fund versus the Long-Short Equity category, for example. One could even contextualize their multi-asset portfolio among a chosen peer group if desired.
Here at Venn, we are excited to continue building our feature set based on a mission to best serve our clients. Venn is already a leader in manager evaluation, especially across opaque multi-asset portfolios, and with peer group analysis, we are excited to bring even more robust analysis to such a critical workflow.
References:
1This can be separately verified by looking at metrics like value at risk or kurtosis, which are also available in Venn’s PGA.
The information contained in this article is provided for general informational and educational purposes only, and should not be construed as investment advice. The contributor to this material is associated with a client of Two Sigma Investor Solutions, LP (“TSIS”). Neither TSIS nor its affiliates have compensated the contributor for his statements. The statements from the interview have been edited and reformatted by TSIS with the contributor’s approval. Unless otherwise noted, the contributor’s statements do not represent the actual views or opinions of TSIS or its affiliates, or any officers, directors, or employees thereof.
This article is not an endorsement by Two Sigma Investor Solutions, LP or any of its affiliates (collectively, “Two Sigma”) of the topics discussed. The views expressed above reflect those of the authors and are not necessarily the views of Two Sigma. This article (i) is only for informational and educational purposes, (ii) is not intended to provide, and should not be relied upon, for investment, accounting, legal or tax advice, and (iii) is not a recommendation as to any portfolio, allocation, strategy or investment. This article is not an offer to sell or the solicitation of an offer to buy any securities or other instruments. This article is current as of the date of issuance (or any earlier date as referenced herein) and is subject to change without notice. The analytics or other services available on Venn change frequently and the content of this article should be expected to become outdated and less accurate over time. Any statements regarding planned or future development efforts for our existing or new products or services are not intended to be a promise or guarantee of future availability of products, services, or features. Such statements merely reflect our current plans. They are not intended to indicate when or how particular features will be offered or at what price. These planned or future development efforts may change without notice. Two Sigma has no obligation to update the article nor does Two Sigma make any express or implied warranties or representations as to its completeness or accuracy. This material uses some trademarks owned by entities other than Two Sigma purely for identification and comment as fair nominative use. That use does not imply any association with or endorsement of the other company by Two Sigma, or vice versa. See the end of the document for other important disclaimers and disclosures. Click here for other important disclaimers and disclosures.
This article may include discussion of investing in virtual currencies. You should be aware that virtual currencies can have unique characteristics from other securities, securities transactions and financial transactions. Virtual currencies prices may be volatile, they may be difficult to price and their liquidity may be dispersed. Virtual currencies may be subject to certain cybersecurity and technology risks. Various intermediaries in the virtual currency markets may be unregulated, and the general regulatory landscape for virtual currencies is uncertain. The identity of virtual currency market participants may be opaque, which may increase the risk of market manipulation and fraud. Fees involved in trading virtual currencies may vary.