
In the world of investment analysis, comparing “apples to oranges” can lead to unintuitive and misleading conclusions. This often makes a more direct “apples-to-apples” comparison essential for informed decision-making. Evaluating the performance of private and public investments is a common example in today’s market cycle, where private credit and private equity have gained significant prominence in multi-asset portfolios.
Venn has stepped in to help solve this challenge, enabling apples-to-apples performance comparisons by leveraging public market equivalents (PMEs). Before diving into what PMEs are and how they work, let’s quickly review why comparing private and public asset performance is like comparing apples to oranges in the first place.
Apples to Oranges: Private and Public Market Performance
Private market funds are illiquid and involve expert orchestration of cash flows between investors and fund managers. This is one reason why cash flow modeling is so important for investors. The timing and magnitude of these cash flows can meaningfully affect the resulting internal rate of return (IRR), the preferred performance metric for private assets.
For example, in Exhibit 1 we show the IRR of an anonymous private asset fund over time. More specifically, each point represents the IRR using all available cash flows up until that point. Notice that in early periods the IRR is negative as an investor must contribute capital to the fund manager (negative cash flows). IRR calculations typically become more positive over time as distributions back to the investor begin (positive cash flows). This dynamic leads to the typical J-curve pattern we show below.1
Exhibit 1: Net IRR J-Curve of an Anonymous Private Asset Fund
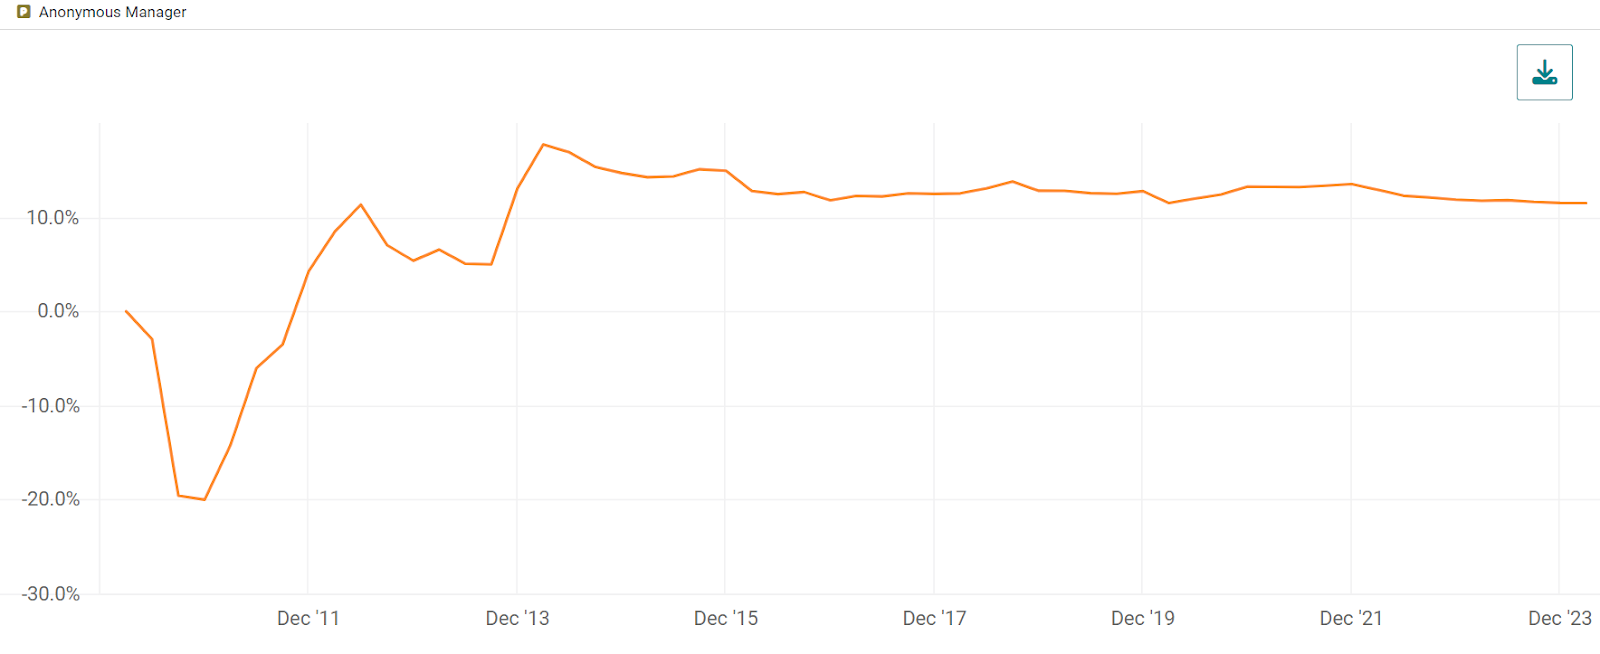
Source: Venn by Two Sigma
In public markets, typically a time-weighted return (TWR) is used to measure performance. This is the “fact sheet” return that ignores when one purchases a fund, buys or sells shares, or liquidates a position. In other words, investor-specific cash flows are not accounted for.
Apples to Apples with Public Market Equivalents
PMEs are designed to create a level playing field to help investors confidently answer the question: “Did my private asset investment outperform its public benchmark, and if so, by how much?”
Venn offers many different PME techniques in its new Private Asset Lab (PAL), accommodating the practices of various practitioners. For simplicity, this post will focus on the direct alpha PME (DA), but importantly, all PMEs share the same goal of enabling an apples-to-apples comparison with a public market benchmark.
The DA approach discounts each private asset cash flow by movements in an appropriate public market benchmark. By using discounted cash flows to calculate IRR, public market movements can be effectively neutralized. As a result, the output of DA should represent the annualized excess return that the private asset has achieved above the public market benchmark at each point in time.
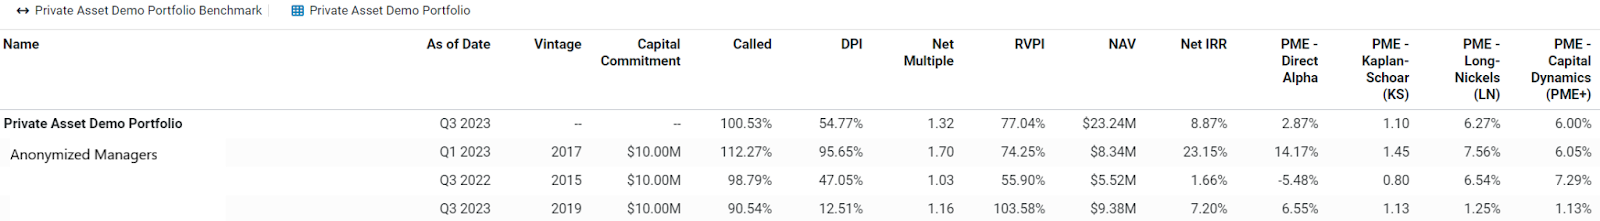
For example, below we show a hypothetical equal commitment to a buyout, direct lending, and real estate fund, while using the iShares S&P 500 ETF (IVV), the Invesco Senior Loan ETF (BKLN), and the iShares US Real Estate ETF (IYR) to build a composite public benchmark. We also included a summary performance table of the portfolio, providing transparency into the anonymized individual holdings.
Exhibit 2: Hypothetical Private Asset Portfolio’s Direct Alpha
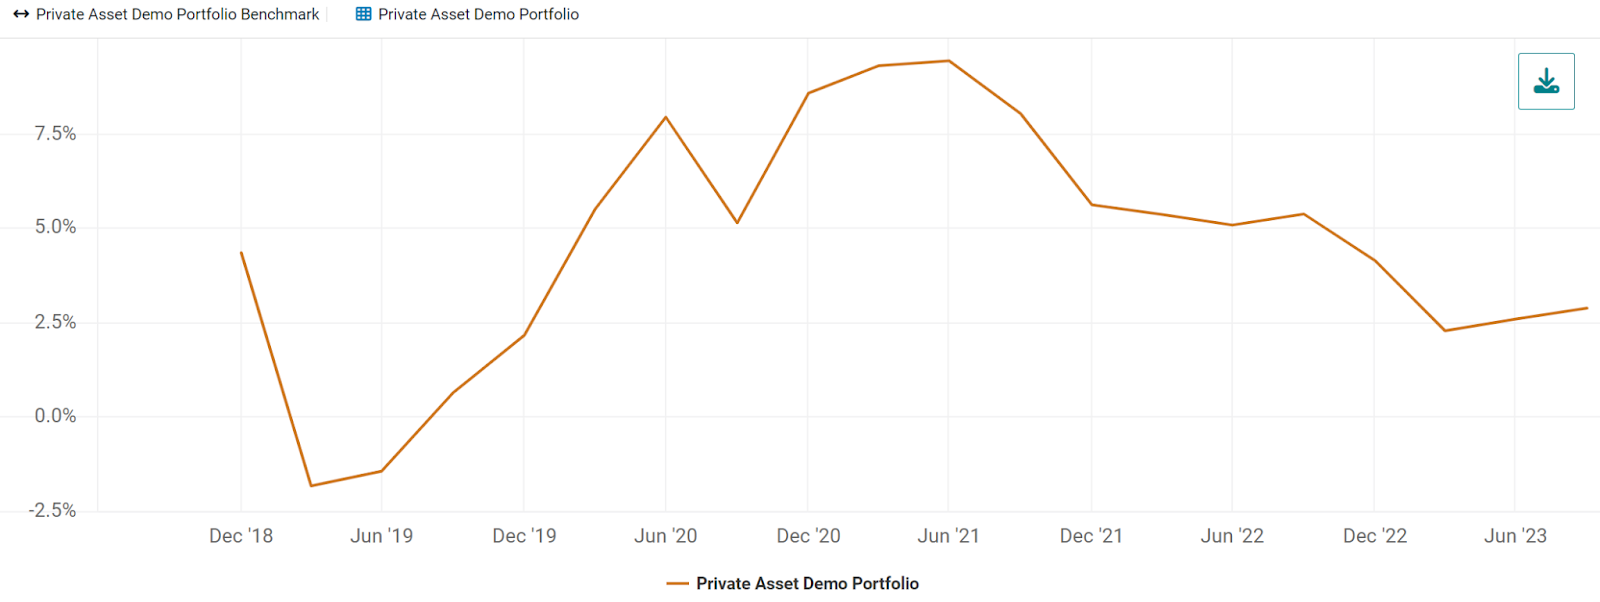
Source: Venn by Two Sigma
As we can see in Exhibit 2, this portfolio was underperforming public markets early on in our analysis period, but ultimately achieved 2.87% annualized excess return as of Q3 2023. This may seem like a simple chart and conclusion, but that is ultimately what PMEs aim to achieve, just on an apples-to-apples basis. Understanding the magnitude of outperformance of private assets over public markets can be critically important for asset allocation decisions, cost-benefit analysis, and more. This is especially true in a portfolio with the flexibility to invest in either private or public assets.
Notably, we can see that our anonymous real estate manager in the Exhibit 2 table (row 3) had a direct alpha of -5.48% versus our composite benchmark. But our portfolio’s composite public benchmark may not be appropriate for our real estate manager on a standalone basis. As a result, let’s take a closer look at that manager's outperformance with the real estate ETF as the sole public asset benchmark.
Exhibit 3: Real Estate Manager’s Direct Alpha
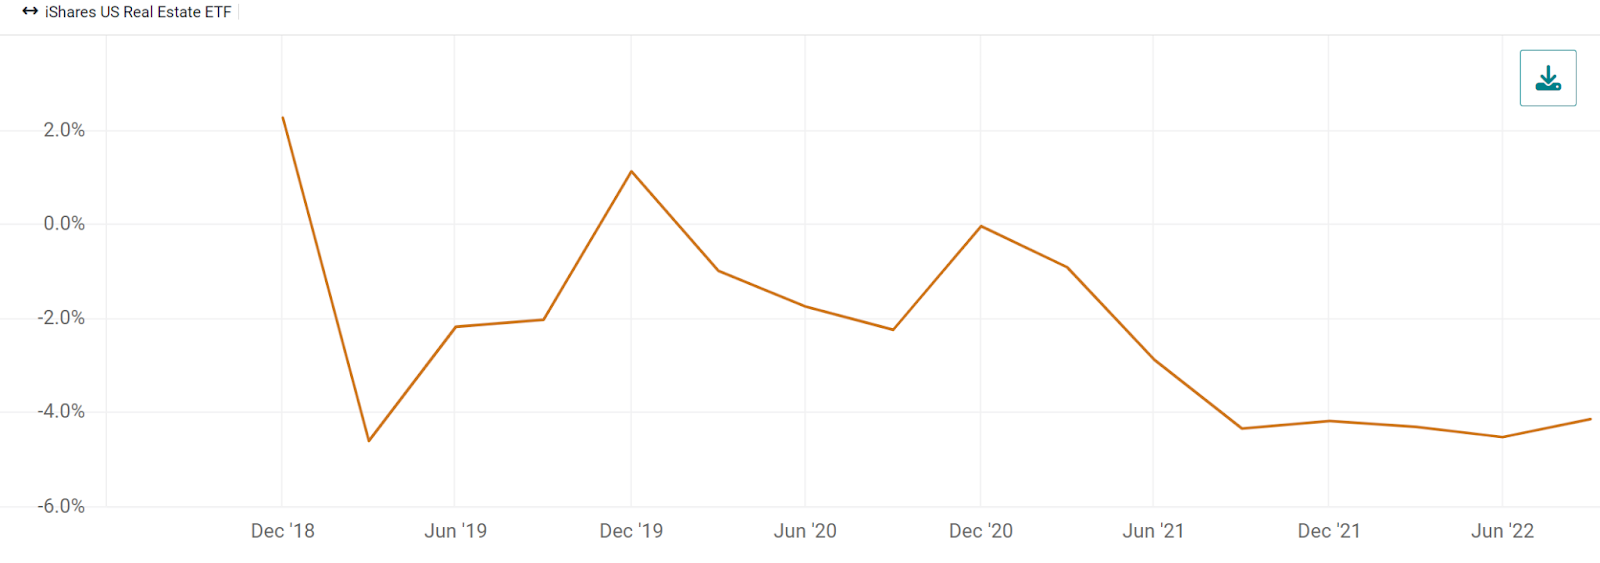
Source: Venn by Two Sigma
As we can see in Exhibit 3, this manager has underperformed public real estate by -4.15% per year. Given the friction associated with investing in private assets (covered more in the next section), this underperformance may kick off formal investigation from an investment team to assess their decision.
Private Versus Public Markets and the Role of PMEs
While private markets have many attractive characteristics, they are undoubtedly more complicated to invest in than public markets. They may require leverage, specialized teams, legal contracts, and include unique structures and liquidity risks. As a result, understanding how a private portfolio, sleeve, or individual manager might perform in comparison to a public benchmark is critically important to ensure efficient asset allocation.
It is important to note that off-the-shelf PME solutions typically don’t incorporate the friction associated with investing in private assets in comparative analysis. In the case of the direct alpha approach, it's likely not enough to just have positive excess return versus a public benchmark, but rather, the alpha generated must also offset the associated frictions of investing in private assets. The performance hurdle that a given private asset will need to overcome to justify its investment over public market alternatives is specific to each investment team making the decision, and may also vary based on private asset risk, structure, or other criteria.
An Orchard of Insights into Private and Public Market Performance
PMEs are part of Venn’s new Private Asset Lab offering, which includes features such as desmoothing, cash flow modeling, access to an extensive private asset data library, and the ability to view performance metrics over time. With the addition of PMEs, Venn clients now have a solution that we believe is both intuitive and effective to benchmark their private investments to public markets. We believe more performance transparency and more capable analytics will ultimately lead to more informed asset allocation decisions, especially among portfolios combining public and private investments.
For more apple-themed investment commentary, please check out apple picking and finding alpha.
Private asset portfolios are less liquid than public asset portfolios and have additional risks, including the risk of loss. Cash flow modeling is dependent on assumptions of uniform fund behaviors according to fund characteristics, and historical data availability. The future cash flow timing and needs of specific investments will differ from the model results, at times significantly. Estimations using Public Market Equivalents have many inherent limitations. This article is not a recommendation as to any portfolio, allocation, strategy or investment, nor an offer to purchase or sell any security.
References:
1 https://news.crunchbase.com/venture/inside-the-ups-and-downs-of-the-vc-j-curve/
References to the Two Sigma Factor Lens and other Venn methodologies are qualified in their entirety by the applicable documentation on Venn.
This article is not an endorsement by Two Sigma Investor Solutions, LP or any of its affiliates (collectively, “Two Sigma”) of the topics discussed. The views expressed above reflect those of the authors and are not necessarily the views of Two Sigma. This article (i) is only for informational and educational purposes, (ii) is not intended to provide, and should not be relied upon, for investment, accounting, legal or tax advice, and (iii) is not a recommendation as to any portfolio, allocation, strategy or investment. This article is not an offer to sell or the solicitation of an offer to buy any securities or other instruments. This article is current as of the date of issuance (or any earlier date as referenced herein) and is subject to change without notice. The analytics or other services available on Venn change frequently and the content of this article should be expected to become outdated and less accurate over time. Any statements regarding planned or future development efforts for our existing or new products or services are not intended to be a promise or guarantee of future availability of products, services, or features. Such statements merely reflect our current plans. They are not intended to indicate when or how particular features will be offered or at what price. These planned or future development efforts may change without notice. Two Sigma has no obligation to update the article nor does Two Sigma make any express or implied warranties or representations as to its completeness or accuracy. This material uses some trademarks owned by entities other than Two Sigma purely for identification and comment as fair nominative use. That use does not imply any association with or endorsement of the other company by Two Sigma, or vice versa. See the end of the document for other important disclaimers and disclosures. Click here for other important disclaimers and disclosures.
This article may include discussion of investing in virtual currencies. You should be aware that virtual currencies can have unique characteristics from other securities, securities transactions and financial transactions. Virtual currencies prices may be volatile, they may be difficult to price and their liquidity may be dispersed. Virtual currencies may be subject to certain cybersecurity and technology risks. Various intermediaries in the virtual currency markets may be unregulated, and the general regulatory landscape for virtual currencies is uncertain. The identity of virtual currency market participants may be opaque, which may increase the risk of market manipulation and fraud. Fees involved in trading virtual currencies may vary