
Modern Portfolio Theory explores the relationship between risk and return, as well as the benefits of diversification. When applied to practical investing, it likely gave rise to the widely used portfolio categories: Conservative, Moderate, and Aggressive (CMA).
CMA allows for the quick bucketing of a portfolio across the risk and return spectrum, making it a powerful tool for scaling an investment practice or quickly understanding a manager’s expected risk profile. However, like many categorizations in the investment world, it is essential to look deeper than the label.
On February 7th, 2024, Venn by Two Sigma announced a partnership with SimCorp, incorporating data from Axioma risk models to derive its equity style risk factors and help asset owners and advisors manage portfolio risk. This blog's joint research specifically aims to help investment professionals better understand the underlying risk of CMA categories and associated managers.
We will analyze CMA categories in two ways. First, we will provide top-level data on the relationship of these categories over time. We will then analyze an individual manager's performance in concert with their category label using the Two Sigma Factor Lens.1 By the end of this piece, we hope investors have more context around CMA allocations and the importance of individual manager due diligence as a source of truth.
The Relationship Between Conservative, Moderate, and Aggressive Fund Categories
Using Venn’s Peer Group Analysis, we extracted aggregate statistics for each category across different periods. For example, Exhibit 1 shows the median volatility for each CMA category across calendar years.2 This means that within each category, half of the managers experienced lower volatility than the median, while the other half experienced higher volatility. Summary statistics like this show that typically funds do behave as their CMA categories suggest. Conservative-designated funds having much lower volatility than Moderate, with Moderate having less volatility than Aggressive. So far, so good.
Exhibit 1: Median Volatility by Investment Category
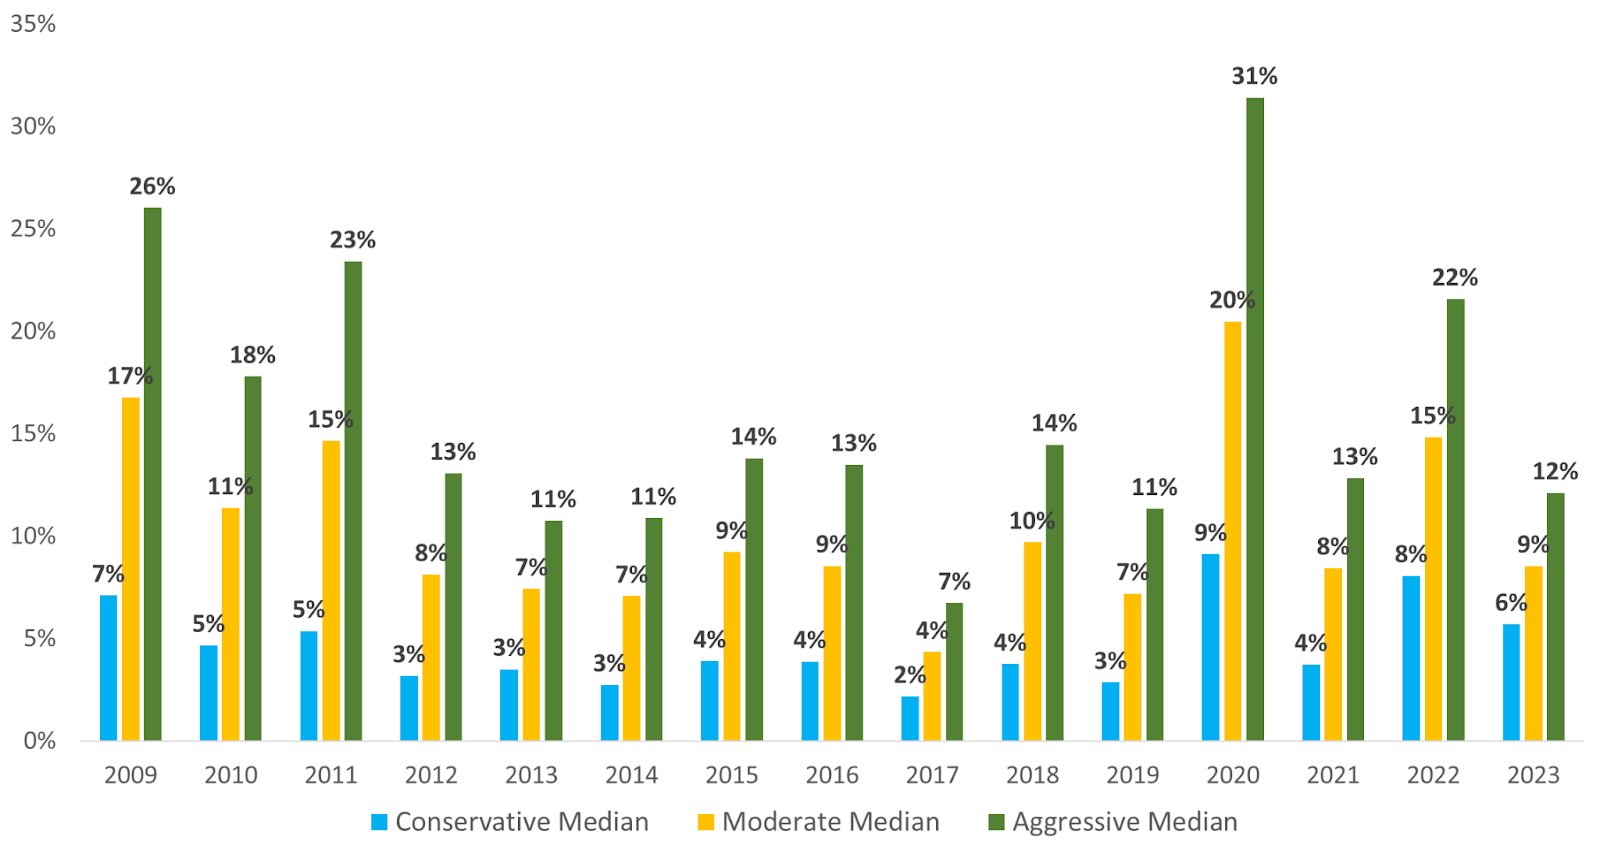
Source: Venn by Two Sigma. Calendar years represented by January 1st to January 2nd of the following year to allow enough trading days for Venn to calculate daily volatility.
We can use the same data to examine relationships between categories.
- For example, in 2009, the Conservative median volatility was 7%, while Aggressive was 26%.
- A simple ratio of Aggressive to Conservative tells us that Aggressive’s median volatility was almost 4x higher.
- By plotting ratios between Moderate and Conservative median volatility, as well as between Aggressive and Conservative, we can observe how these relationships have evolved over calendar years.
As we can see in Exhibit 2, the volatility ratio from other categories to Conservative has been falling over time. In 2023, Aggressive’s median volatility was only 2.1x that of Conservative, its lowest point over our analysis. Exhibit 2 indicates that while Conservative remains lower risk compared to Moderate and Aggressive, its relatively lower volatility profile has been decreasing.
Exhibit 2: Changes in Volatility Ratios Over time
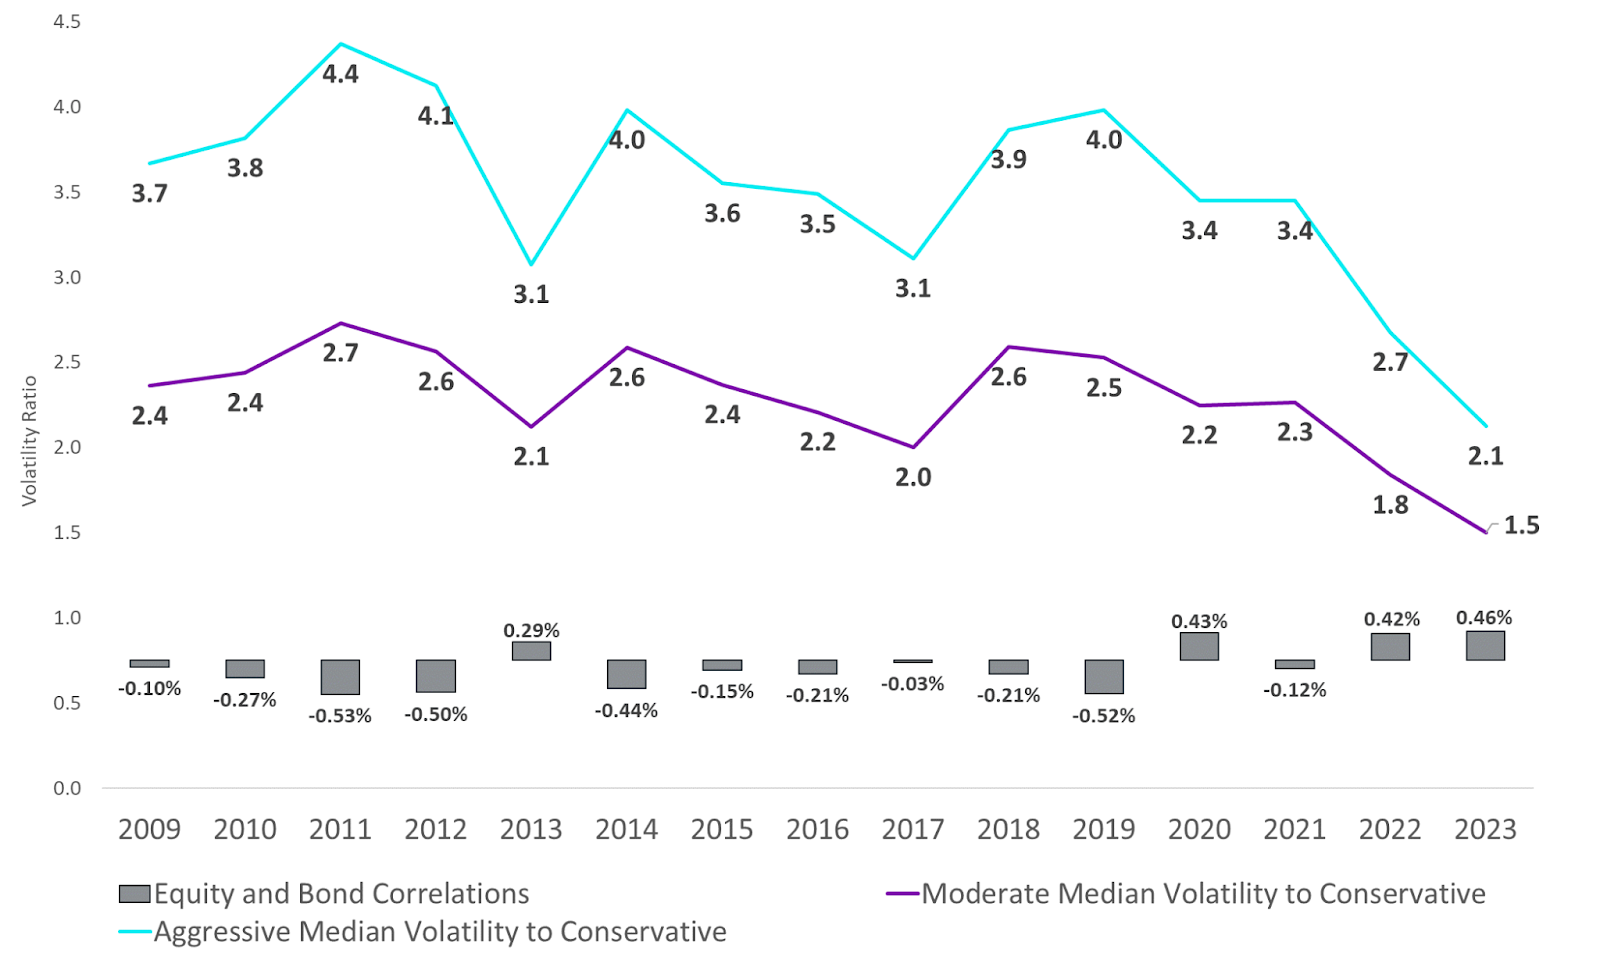
Source: Venn by Two Sigma. Bond and Equity correlations measured by the iShares MSCI ACWI ETF (ACWI) and the iShares U.S AGG Bond ETF (AGG). Calendar years represented by January 1st to January 2nd of the following year to allow enough trading days for Venn to calculate daily volatility.
- One explanation for this may be that the diversification benefits of fixed income and equities have diminished over recent years due to higher inflation and rising rates.
- Because Conservative managers are likely overweight fixed income, the higher correlation between equities and bonds may have raised their relative volatility.
- Looking at the black bars at the bottom of Exhibit 2 suggests that has indeed been the case.
For example, the spread in median volatility was greatest when correlations with bond and equities were most negative (2011, 2012, 2014, 2019), but median volatility across categories becomes more similar when correlations between equities and bonds are positive. Put plainly, Aggressive and Conservative have had more similar volatility when equities and bonds were highly correlated. This makes intuitive sense, but it does suggest that Conservative funds may not always be as conservative as their owners might hope, although they are still more conservative (i.e., less volatile) than Aggressive funds.
We also found that the relative difference in volatility is not correlated with the absolute level of equity volatility. The correlations between relative ratios with equity volatility using calendar years are close to zero.
Analyzing Risk Within Conservative, Moderate, and Aggressive Fund Categories
We can explore similar volatility relationships within each category. For instance, how much higher is the volatility between the managers with the lowest and highest volatility, and how does that change over time? To approximate this, we can use the 5th and 95th percentiles as boundaries. These percentiles will help us bucket where the 5% of managers with the lowest volatility and the 5% with the highest volatility fall within each category.
Exhibit 3 tells us that there is a much wider range of volatility among the lowest and highest vol managers within the Conservative category. More specifically, in 2023 the percentile associated with the highest volatility managers was roughly 2.7x the lowest volatility percentile for the Conservative category. To put this in absolute terms, the lowest volatility managers experienced 3.35% volatility or lower versus the highest volatility managers experiencing 9.14% or higher. What a difference! This raises the question: “Is conservative in the eye of the beholder or could some funds be mislabeled?”
Exhibit 3: Volatility Ratios of the Highest Volatility Managers with the Lowest Volatility Managers Within Each Category
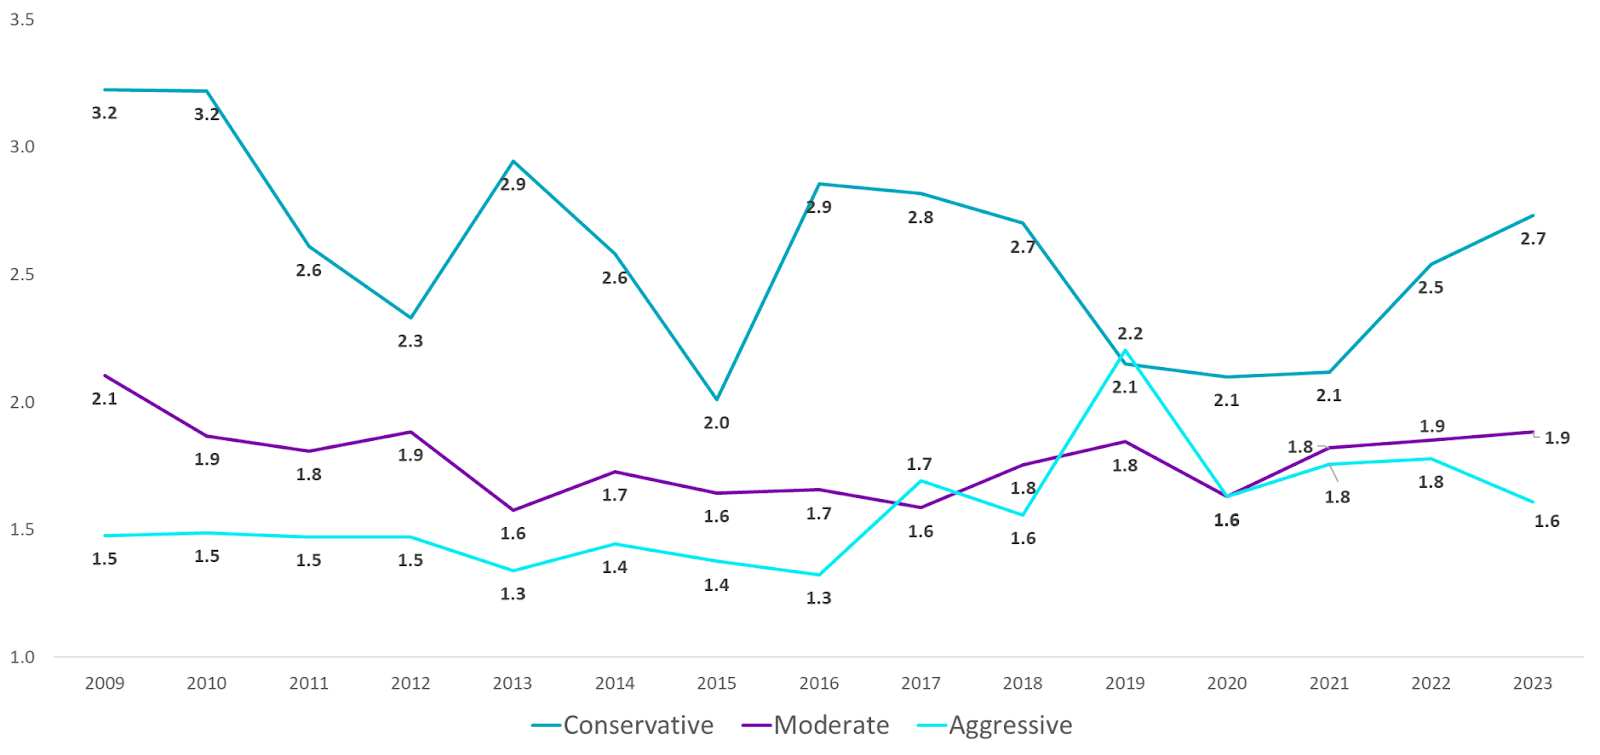
Source: Venn by Two Sigma. Calendar years represented by January 1st to January 2nd of the following year to allow enough trading days for Venn to calculate daily volatility.
In Exhibit 3, we also see that the difference between the highest and lowest volatility managers in 2023 was much smaller (although still significant) for Moderate and Aggressive categories at 1.9x and 1.6x, respectively. This analysis defines the larger spectrum of risk within the Conservative category, which if volatility is your measurement of choice, may put even more emphasis on manager due diligence for Conservative managers.
Evaluating a Higher Volatility Conservative Manager Over Time
Given the wider spectrum of risk in Conservative, we chose an anonymous higher-volatility manager within that category to analyze. While this exercise cherry-picks one of the least conservative “Conservative” managers, it is a real example nonetheless. This includes using the Two Sigma Factor Lens to see how the manager achieved their results.
Starting with a simple assessment of risk and return statistics (Exhibit 4), we already see some noticeable results.
- For example, the higher-volatility manager (over the full common period with our 20/80 Conservative benchmark3) posted a staggering 16.35% volatility, while our benchmark was just 4.59%.
- While the manager’s return was higher, their Sharpe ratio was considerably lower. Again, this manager is currently classified as Conservative both by categorization and their fund name.
We included 5-year statistics because they tell an entirely different story. In fact, over the last 5 years this manager had starkly different results, posting a higher return and lower volatility than the benchmark.
Exhibit 4: Performance and Risk of the Higher Volatility Conservative Manager
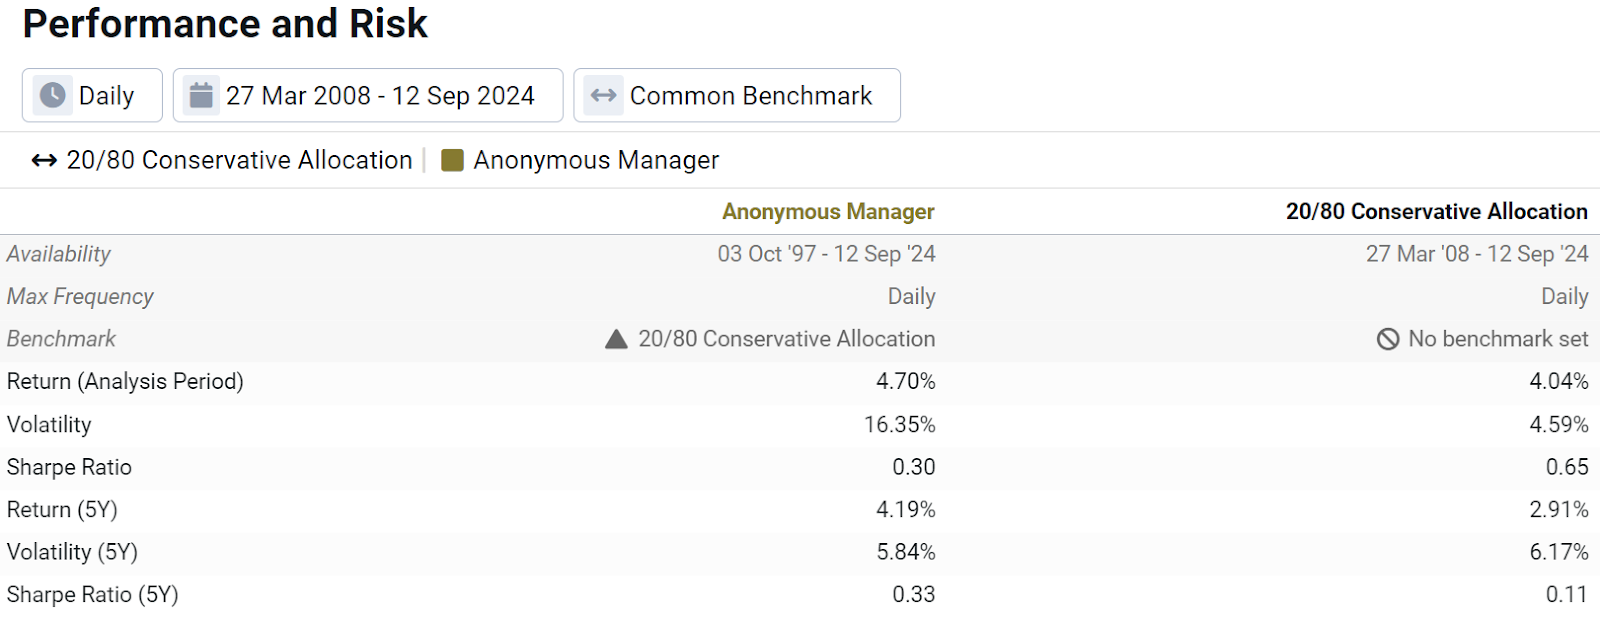
Source: Venn by Two Sigma
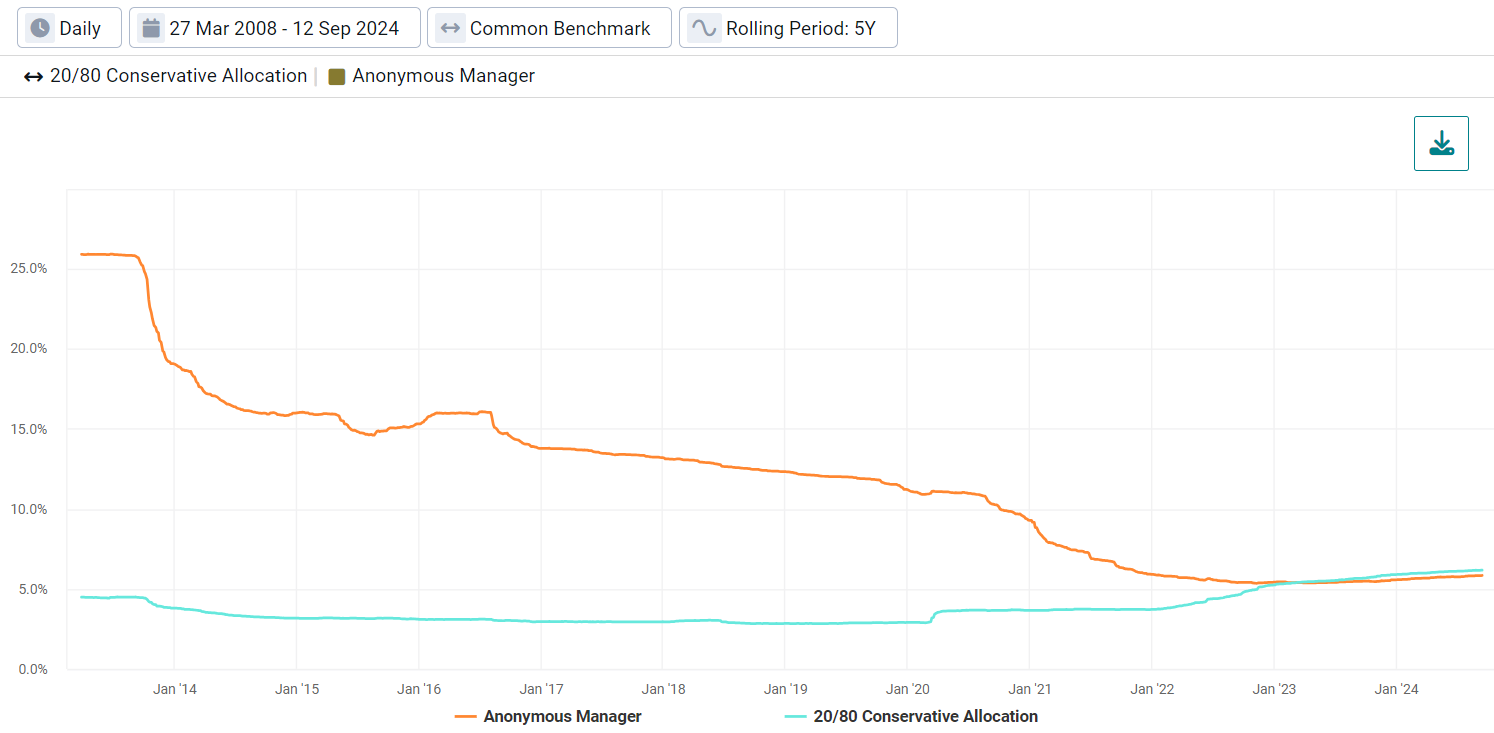
Rolling 5-year volatility paints a fuller picture, showing that the manager has aggressively, yet consistently, reduced their volatility for more than a decade.
Exhibit 5: Rolling 5-Year Volatility of the Manager and Conservative Benchmark
Source: Venn by Two Sigma
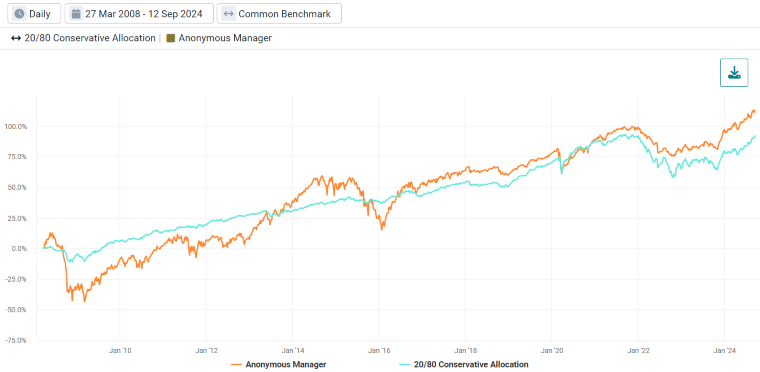
Looking at cumulative returns in Exhibit 6 tells a similar story.
- At some points, an investor may have been happy with their manager’s higher return, but it is also likely that they were disappointed when this manager experienced significant relative drawdowns.
- For example, around May 2015 to January 2016 there was a period when they were down roughly -25%, but the Conservative benchmark was down around -2.5%.
Especially for conservative investors, who likely put more emphasis on capital preservation, it is fair to ask if this is truly conservative behavior.
Exhibit 6: Cumulative Return of the Manager and Conservative Benchmark
Source: Venn by Two Sigma
In Exhibit 7, we show the median realized volatility, return, and Sharpe ratio for each category over the last five years.4 There is clear overlap of realized volatility among the categories.
- Over the trailing five years, the highest volatility fund in the Moderate category is far riskier than the median in the Aggressive category.
- It is also interesting to note that at least for the median, the Sharpe ratio is far lower for the Conservative category than it is for the other two.
This may be fine for investors seeking a lower volatility for their investment, but they should be aware of how much return they are giving up.
Exhibit 7: Trailing 5-Year Category Statistics
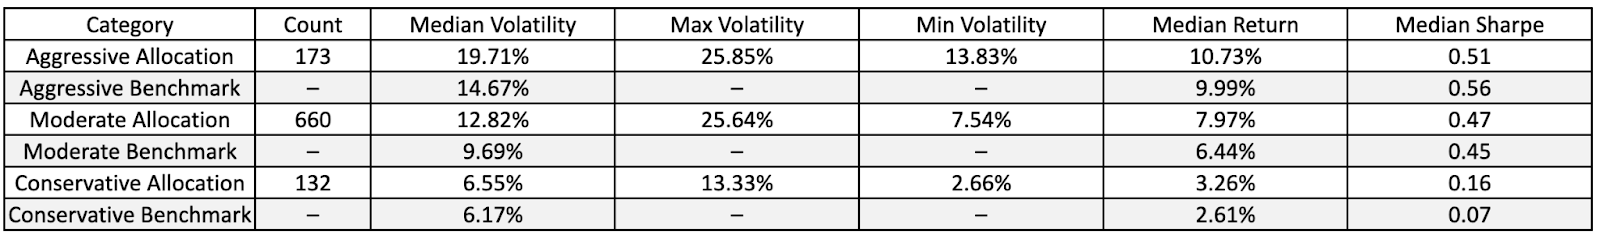
Source: Venn by Two Sigma. Trailing 5-years as of 8/30/2024.
Circling back to our individual manager, by examining risk (Exhibit 5) and return (Exhibit 6), it becomes clear that this manager historically took more risk than their peers, but righted the ship over recent years (perhaps in response to the unusually large drawdown). However, this doesn't answer the question of how this risk was being taken, and what was driving their performance. To answer these questions, we can consult Two Sigma’s Factor Lens within Venn to paint a fuller picture.
Analyzing the Conservative Benchmark Using the Two Sigma Factor Lens
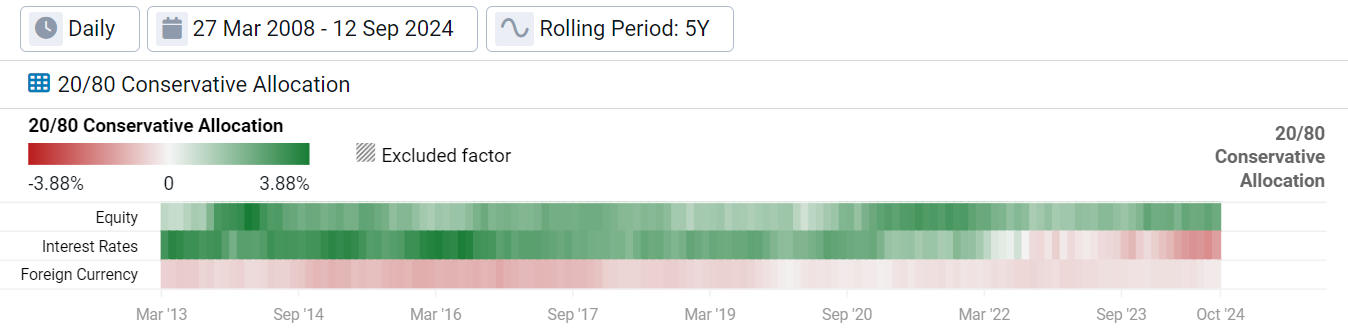
Let’s begin with a simple exercise in factor analysis. Below, we show the rolling 5-year factor exposure of our 20/80 Conservative benchmark over time. We highlight the three strongest and most consistent factor exposures: Equity, Interest Rates, and Foreign Currency. Unsurprisingly, the Interest Rates factor is the strongest exposure given the conservative nature, aligning with a higher allocation to fixed income. The Foreign Currency factor plays a role because the equity position is unhedged global equities, and as Venn has discussed before, a bet on unhedged international assets is a bet on foreign currencies as well.
Exhibit 8: Rolling 5-Year Factor Exposure of the Conservative Benchmark
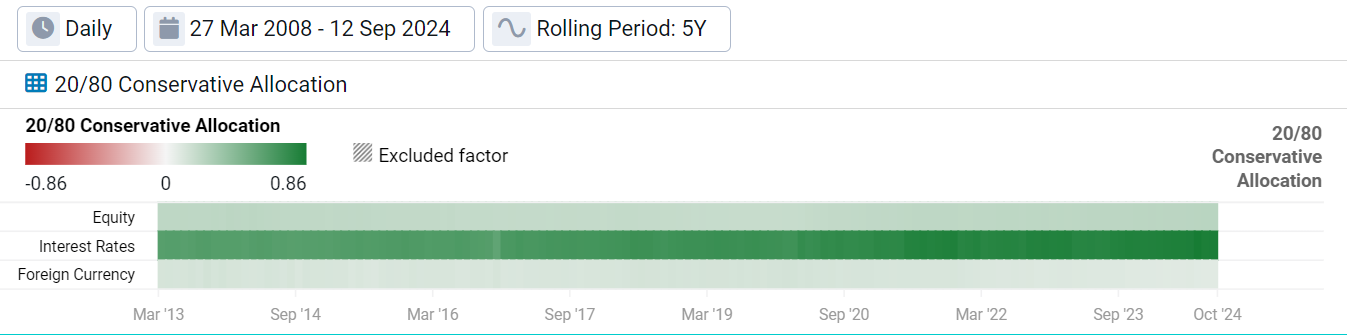
Source: Venn by Two Sigma
We can also look at contributions to return from these factors, which reveal some distinct themes. Green indicates that the benchmark was rewarded for the respective exposure over each 5-year period, and red means it wasn’t.
Exhibit 9: Rolling 5-Year Factor Contribution to Return of the Conservative Benchmark
Source: Venn by Two Sigma
- Positive Equity factor exposure has consistently been rewarded over 5-year periods (Row 1).
- Positive Interest Rates factor exposure (long bonds), has recently been a negative contributor to return. This is likely due to global inflation, inverted yield curves, and rising interest rates (Row 2).
- Foreign currency exposure has dragged on return over all 5-year periods as the USD strengthened (Row 3).
Analyzing the Higher Volatility Manager Using the Two Sigma Factor Lens
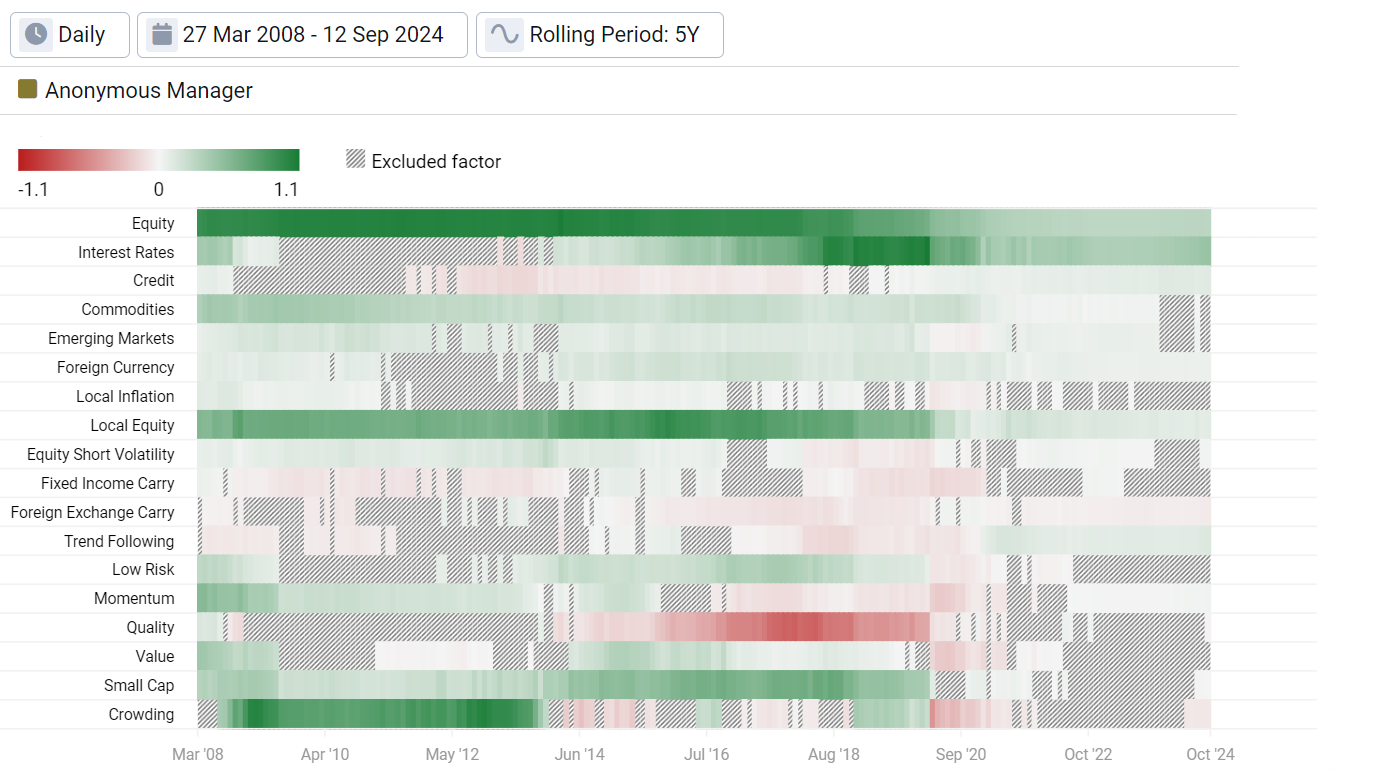
Now that we’ve set the stage with factor analysis of our benchmark, let’s dive deeper into manager due diligence for our chosen Conservative manager. Below we show their factor exposures over 5-year rolling periods. As we can see, there is much more going on than our benchmark, especially in earlier periods.
Exhibit 10: Rolling 5-Year Factor Exposure of the Conservative Manager
Source: Venn by Two Sigma
- This manager’s 5-year beta to our Equity factor was close to 1.00 up until the Covid crash in 2020, after which it began quickly trending toward 0.30 (Row 1).
- Their Interest Rates factor exposure was not deemed relevant by our model during earlier periods but became stronger over time. This likely indicates an increasing allocation to fixed income, but with no meaningful allocation in earlier periods (Row 2).
- The manager seemed to be much more active with factor exposures before 2020, including a positive beta to Commodities, Local Equity (U.S. home bias), and a variety of changing exposures to equity styles. All of these exposures seemed to dwindle in the most recent years, indicating a dramatic change in strategy and a more streamlined conservative approach.
While this manager's risk was much higher than our benchmark’s, they did have higher return over the full period. Let’s take a look at which factors were driving that excess return over time.
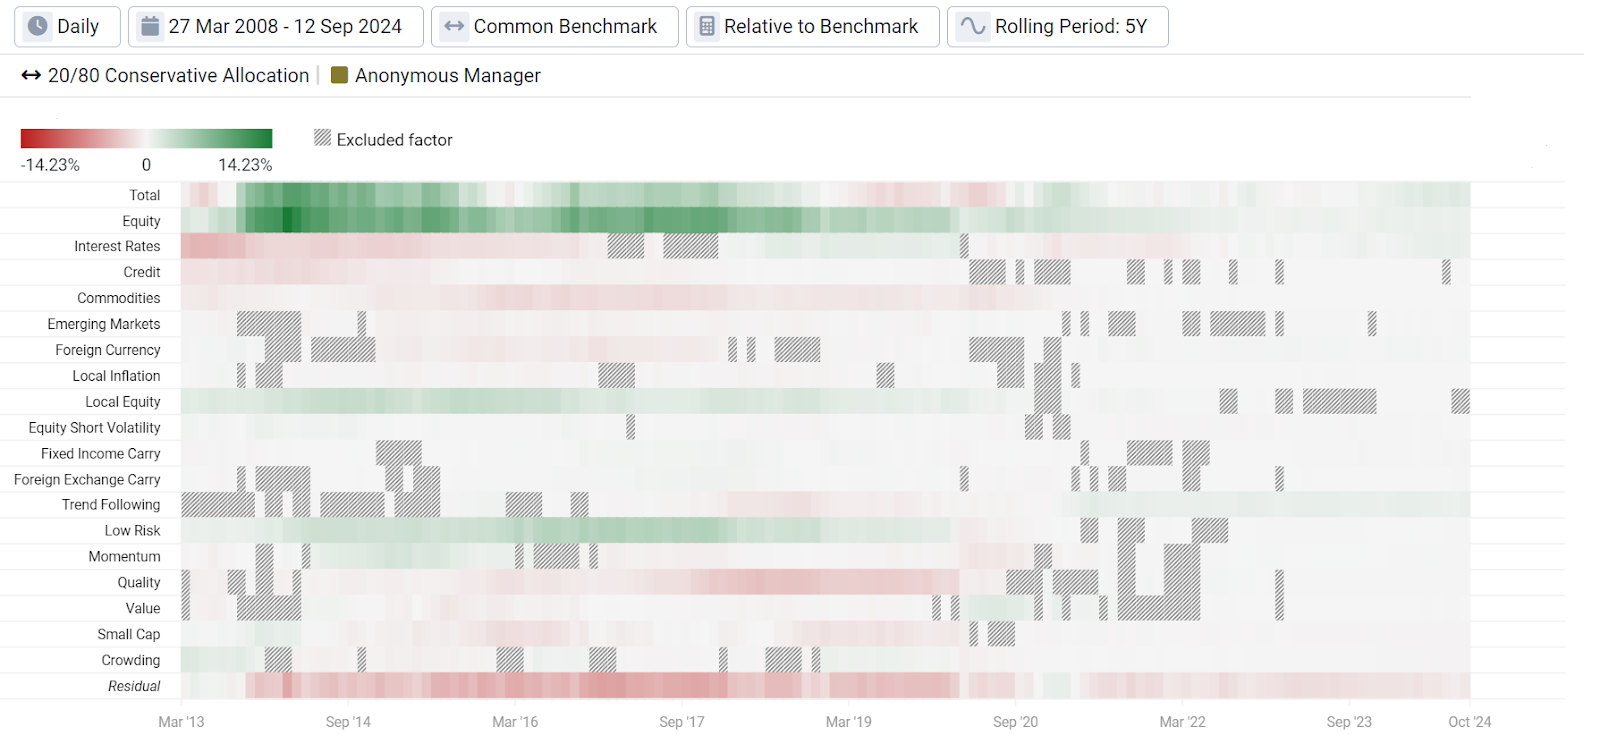
In Exhibit 11, we conducted relative to benchmark analysis, meaning this is the excess return versus the Conservative benchmark attributable to each of Venn’s factors.
Exhibit 11: Rolling 5-Year Relative Factor Contribution to Return of the Conservative Manager Versus the Conservative Benchmark
Source: Venn by Two Sigma
- This manager has clearly benefited from higher Equity factor exposure versus our benchmark over time, as indicated by the strong green coloring (Row 2).
- Residual represents the return that is uncorrelated to the Two Sigma Factor Lens, which some consider a proxy for manager alpha. Their excess return attributable to residual has consistently been negative. It is difficult to know if the manager was explicitly chasing additional alpha or if this was truly just residual (Last Row).
- Up until their more simplified strategy, they were rewarded for some relative factor exposures but not others. However, the largest driver of excess return by far was their large relative exposure to the Equity Factor.
If one went by just the Conservative label, an enormous amount of context for this manager would have been missed, which may have introduced a higher chance for unexpected outcomes. Yes they had higher return, but most of that came from simply having more Equity factor exposure historically. Remember the phrase required for every manager: “past performance is not a guarantee of future performance”!
For an investment team considering this manager, undoubtedly a topic of conversation should be the dramatic change in risk profile over time, why they were so heavily exposed to equities, and whether their strategy is expected to revert back to being relatively higher volatility in the future.
What Does This Mean for Allocators?
Our analysis was not meant to convey positive or negative sentiments about categories or the managers within them, but rather highlight the importance of due diligence beyond a category label.
What it means to be Conservative, Moderate, or Aggressive in relation to each other has changed over time, and likely relies on available diversification between equities and bonds. Equities and bonds have been relatively more correlated recently, and the Conservative category has become riskier in relation to the other two as a result. Within Conservative, there has also been the largest spectrum of risk across managers. There may be many reasons for this: near-zero rates reduce diversification, manager fear of missing out on equity returns, lower equity volatility that “allows” a higher allocation to equities even in a Conservative fund, etc.
Evaluating a higher-risk Conservative manager, we found a dramatic change in risk profile over time. Once dominated by equities, this manager failed to provide strong and consistent alpha from other sources. They eventually aligned themselves with a more typical Conservative profile, but should likely be subject to deep due diligence regarding previous performance and future expectations.
Of course this analysis does not imply that all managers have kept their name but changed their investment stripes. Many managers in each category were far more consistent in their factor exposures, but more importantly, their resulting volatility profile.5 And we do not mean to imply that our sample manager should be avoided, just that they may require a bit more study.
Finally, we hope we have illustrated that the category labels don’t tell the full story of a risk spectrum or manager beyond a quick reference point. Time series analysis, including factor analysis, can paint a fuller picture which may or may not align with investor expectations. We believe that conducting quantitative analysis is essential to make more informed asset allocation decisions, and that in general, all labels should be taken with a grain of salt.
Appendix
Example of a Tried and True Conservative Manager’s Factor Exposures Over Rolling 5-Year Periods
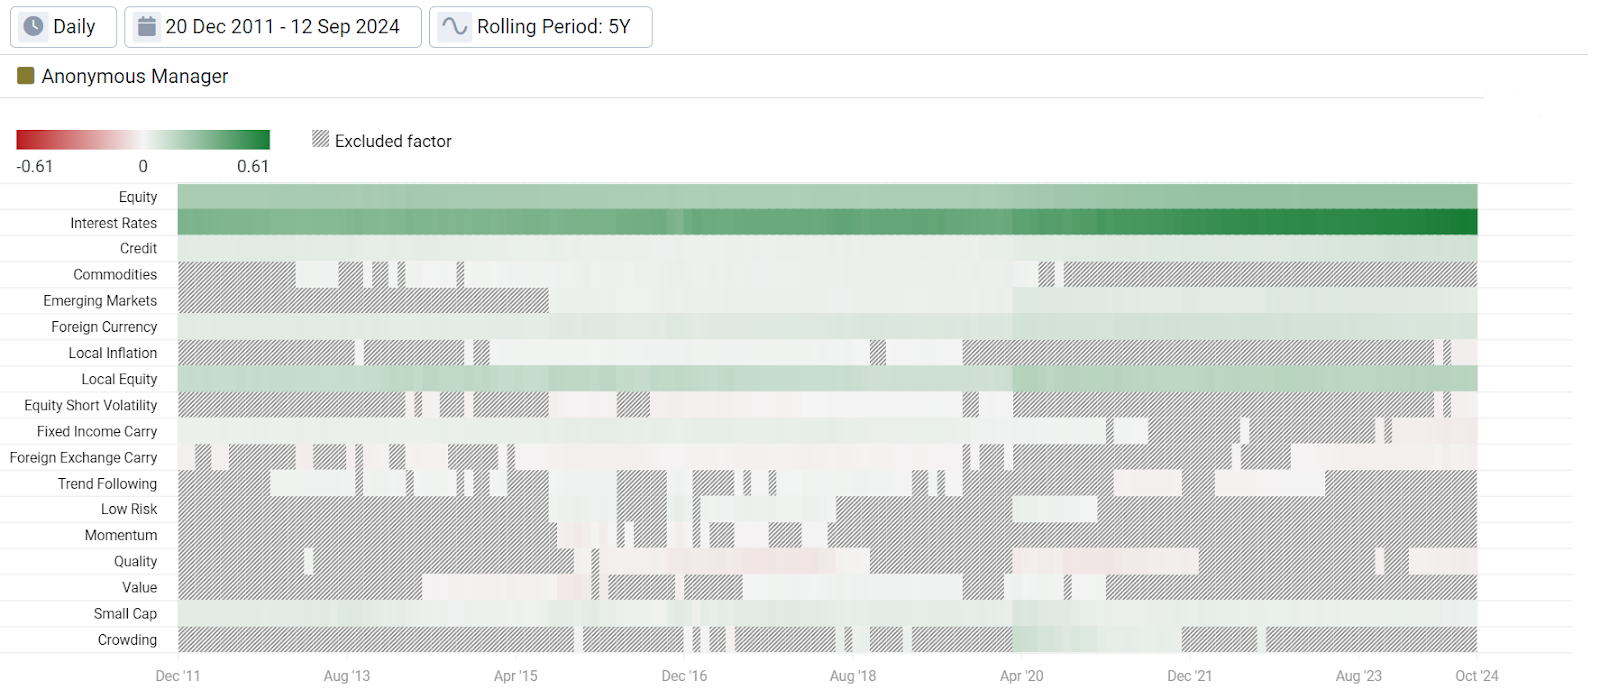
Source: Venn by Two Sigma
References
1 The Two Sigma Factor Lens uses derived outputs from data found in the Axioma World Wide Equity Factor Risk Model and the Axioma US Equity Factor Risk Model.
2 The identification of Conservative, Moderate, and Aggressive categories across Venn’s data library are provided by Morningstar. Due to categories being limited to Venn’s data library and differing calculation methodologies, holdings and analysis are not expected to be a 1:1 match with official Morningstar categories.
3 Conservative benchmark is 20% the iShares MSCI ACWI ETF (ACWI) and 80% the iShares U.S AGG Bond ETF (AGG), rebalanced quarterly.
4 Please note that this analysis is conducted in a slightly different way than other metrics throughout this piece. For example, Venn’s peer group analysis, which was used to pull other data, considers multiple share classes of the same fund and applies fractional weighting when considering category statistics. Rather than trying to replicate that methodology outside of Venn, the statistics in Exhibit 7 are calculated in a straightforward manner using the full list of funds.
5 See our appendix for an example of a tried and true Conservative manager’s factor exposures
* Axioma by Simcorp is a paid vendor of Venn by Two Sigma and was not compensated for these statements.
References to the Two Sigma Factor Lens and other Venn methodologies are qualified in their entirety by the applicable documentation on Venn.
This article is not an endorsement by Two Sigma Investor Solutions, LP or any of its affiliates (collectively, “Two Sigma”) of the topics discussed. The views expressed above reflect those of the authors and are not necessarily the views of Two Sigma. This article (i) is only for informational and educational purposes, (ii) is not intended to provide, and should not be relied upon, for investment, accounting, legal or tax advice, and (iii) is not a recommendation as to any portfolio, allocation, strategy or investment. This article is not an offer to sell or the solicitation of an offer to buy any securities or other instruments. This article is current as of the date of issuance (or any earlier date as referenced herein) and is subject to change without notice. The analytics or other services available on Venn change frequently and the content of this article should be expected to become outdated and less accurate over time. Two Sigma has no obligation to update the article nor does Two Sigma make any express or implied warranties or representations as to its completeness or accuracy. This material uses some trademarks owned by entities other than Two Sigma purely for identification and comment as fair nominative use. That use does not imply any association with or endorsement of the other company by Two Sigma, or vice versa. See the end of the document for other important disclaimers and disclosures. Click here for other important disclaimers and disclosures.