
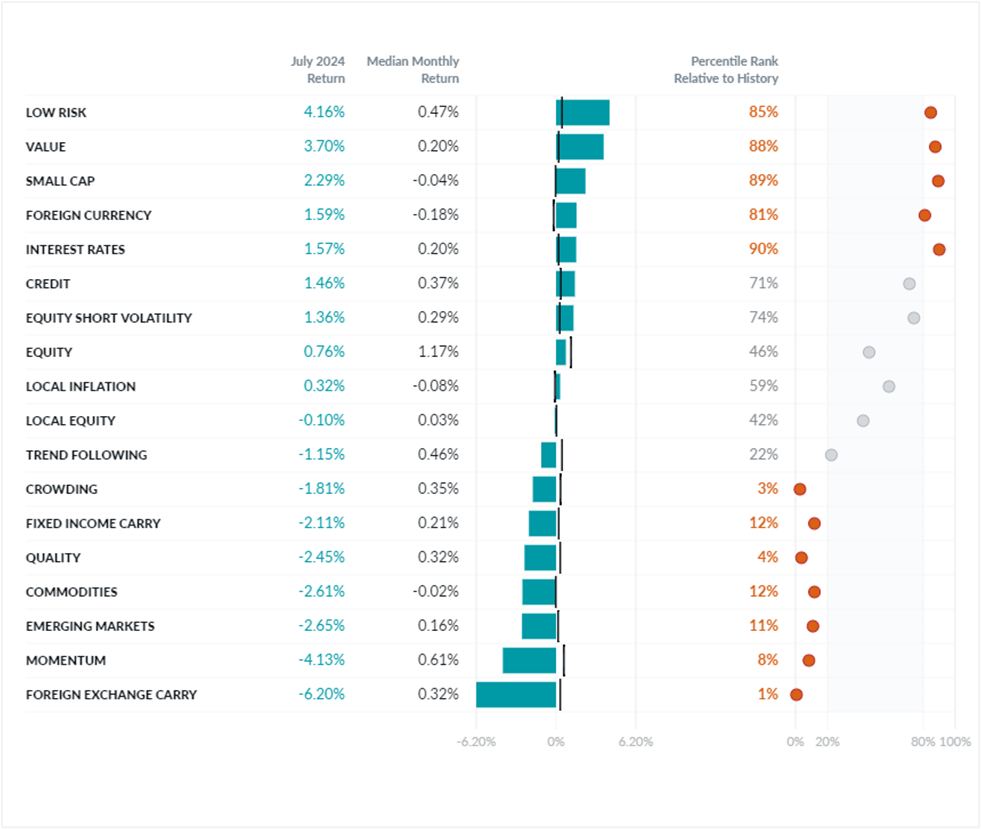
Exhibit 1: July Performance of the Two Sigma Factor Lens
©2024 Two Sigma Investments, LP. This image is for informational purposes only. See https://www.venn.twosigma.com/blog-disclaimer for more disclaimers and disclosures.
Source: Venn by Two Sigma. The median and percentile columns measure the performance of each factor in the Two Sigma Factor Lens relative to the entire history of the factor in USD, using monthly data for the period Oct 1997 - July 2024
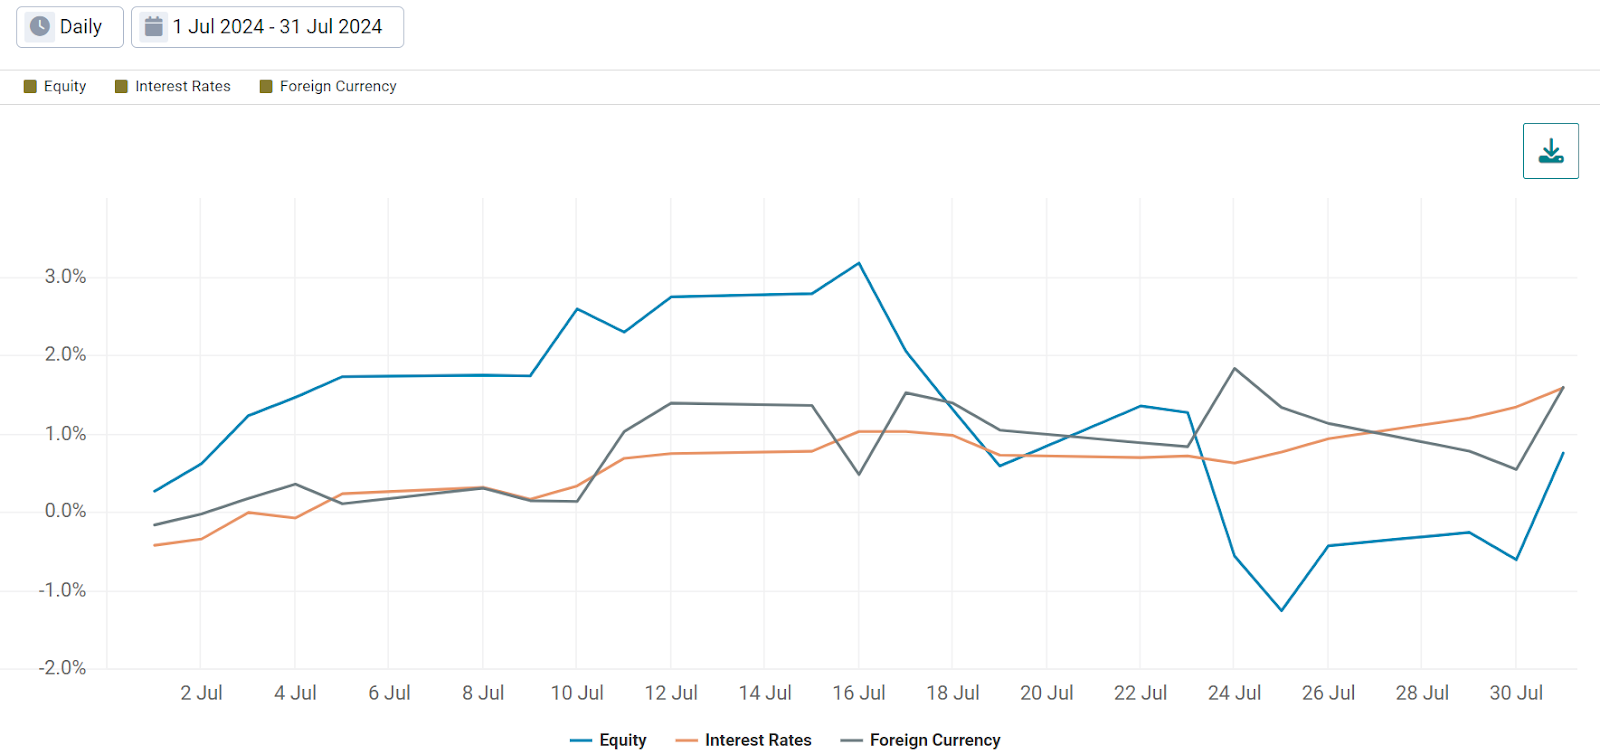
Macro Factors: Our Interest Rates factor performed well throughout the month, rallying on the last day when the U.S. Federal Reserve kept the door open for a potential rate cut in September.
Conversely, our Equity factor was volatile. It was up over 3% through July 16th, but was negative before long. It then rallied alongside our Interest Rates factor on the last day of the month, ultimately finishing positive (Exhibit 2).
In our USD-based factor lens, our Foreign Currency factor is long G10 currencies and short the USD.1 Similar to Equity, this factor reacted sharply to the U.S. Fed meeting when the USD declined due to rate cut expectations. Using the DXY index as a proxy, the USD fell by 0.44% on July 31st alone.2
Exhibit 2: Equity, Interest Rates, and Foreign Currency Factor Performance in July
Source: Venn by Two Sigma
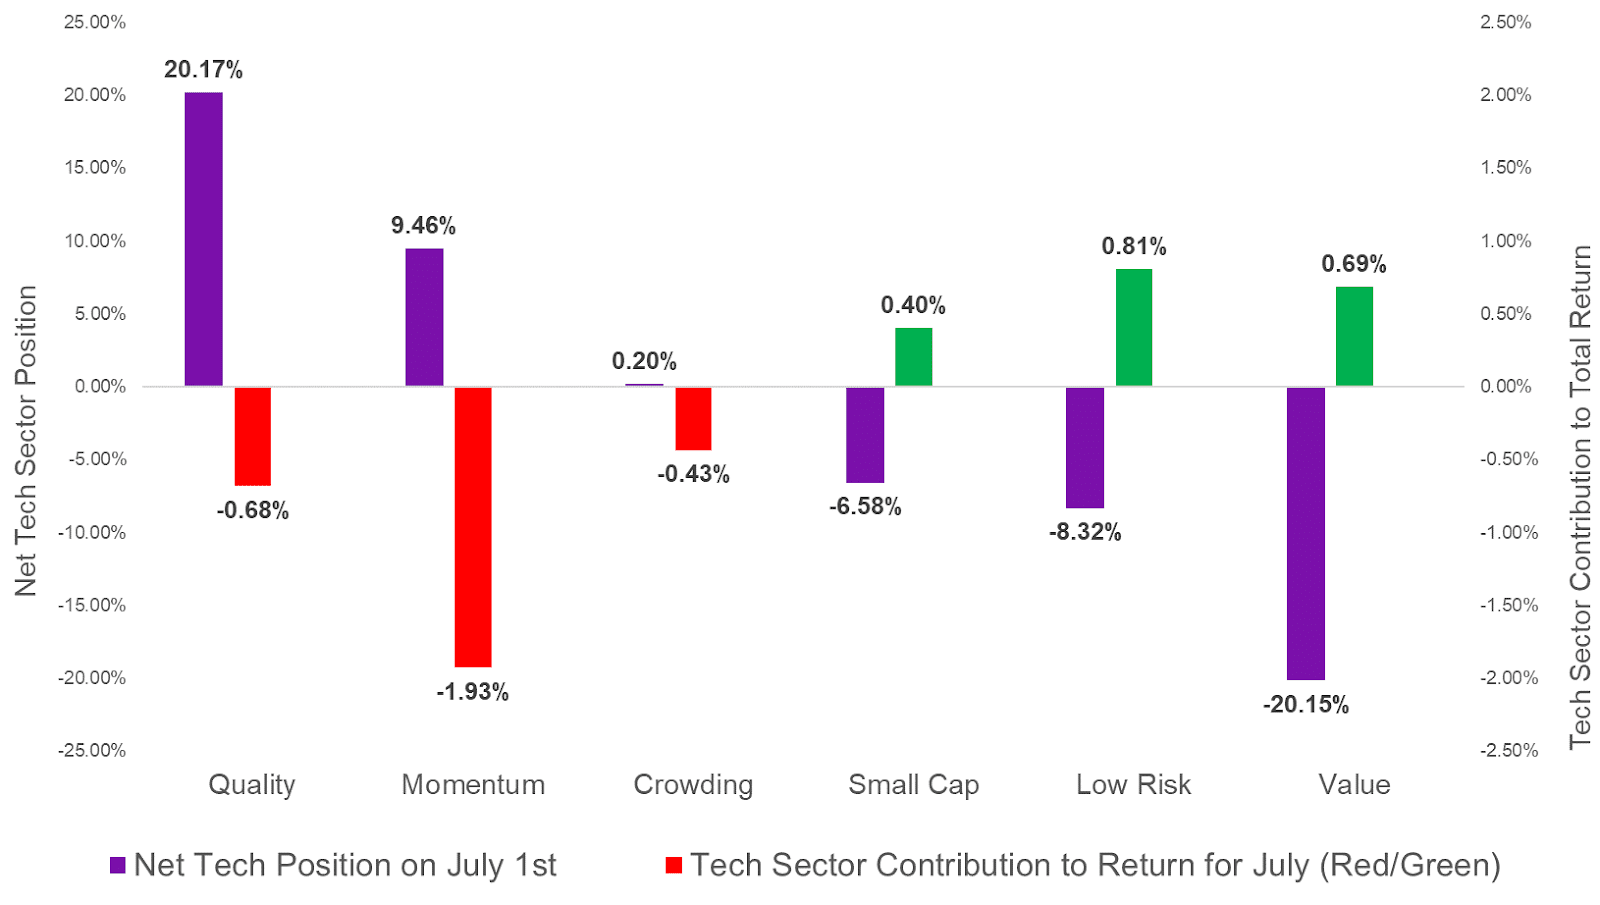
Equity Styles: Our equity styles are not sector neutral, meaning their sector positioning reflects the presence of their respective style. For example, given the relentless tech headlines, Exhibit 3 shows our equity style’s net tech position to start the month of July (Purple). We also provided the contribution to return from the tech sector for the full month.
Exhibit 3: Equity Style Tech Sector Positioning and Contribution to Return
Data sourced from Venn by Two Sigma
In terms of exposure, tech positioning is fairly intuitive and largely in line with historical trends. The tech sector is typically more profitable and has lower debt (long in Quality), larger market cap (short in Small Cap), higher risk (short in Low Risk), and is more expensive (short in Value).3
Notably, there was some disconnect between tech’s net position and its contribution to return for the month. For example, Quality had by far the highest exposure to tech at the start of July, but Momentum had the largest negative tech contribution to return. In other words, contribution to return from the tech sector also depends on stock selection. For example, Momentum had a meaningfully higher long position in NVIDIA. NVIDIA was down -5.3% in July.
An interesting side note: the numbers in Exhibit 2 were more pronounced up until July 30th, but a large tech rally occurred on the final day of the month alongside a smaller equity rally. Tech’s outperformance on this day was fueled, in part, by an attractive earnings report from Advanced Micro Devices. Their earnings report signaled positive tailwinds for other chip makers and the sector broadly.4 More specifically, the iShares Global Tech ETF rose by 2.2% on the final day of the month, while our Equity factor increased by 1.4%.5
Macro Styles: Foreign Exchange Carry was long USD and short JPY in July. The USD fell on Fed rate cut expectations, but the Bank of Japan also surprised markets by raising its benchmark rate on July 31st.6 This drastically reduced interest rate differentials and affected global exchange rates. For example, in the month of July, the USD/JPY exchange rate fell by -7.11%, with the dollar depreciating -1.83% on July 31st alone7 (Exhibit 4). While this factor positions itself across all G10 currencies, the USD and JPY continue to be meaningful drivers of performance.
Exhibit 4: USD/JPY Exchange Rate in July
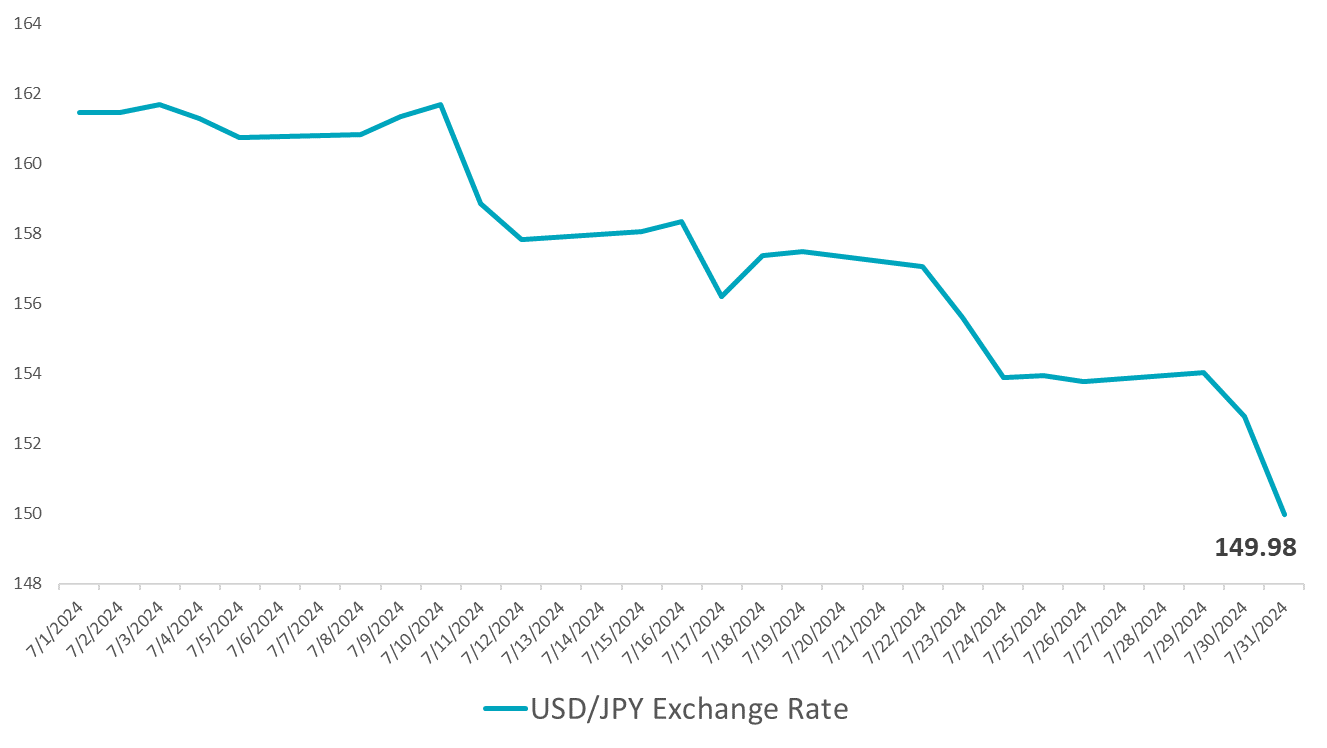
Data sourced from Bloomberg
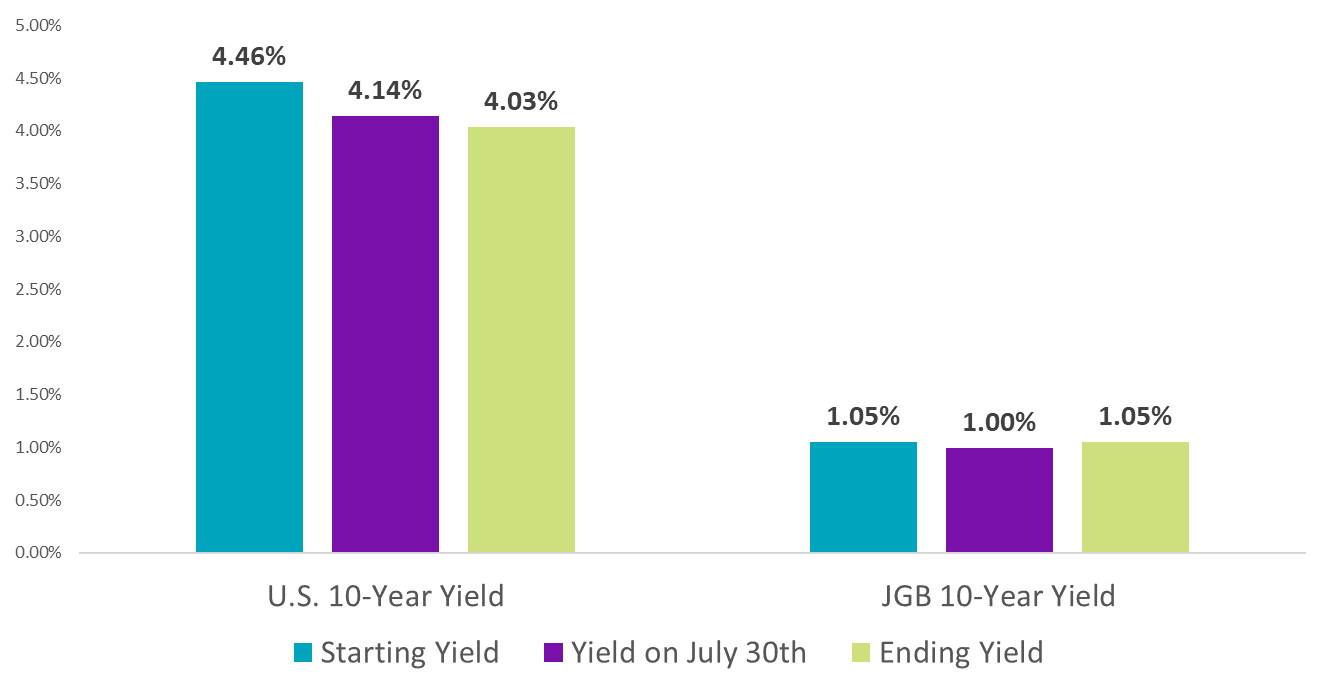
Fixed Income Carry also reacted negatively to similar themes. This factor’s positioning in 10-year bond futures is based on the term spread of the respective country’s yield curve. Given that the U.S. yield curve has been inverted, this factor has been short U.S. government 10-year bond futures. Conversely, it has been long 10-year Japanese government bond futures (JGB) due the unique monetary policy of Japan, which helped their yield curve maintain an attractive term spread relative to other developed countries.8
The yield on the 10-year JGB did fall throughout July, which would have benefited FI Carry, but it rallied on the final day of the month when the BOJ hiked rates. The 10-year U.S. government bond yield fell significantly from 4.46% to 4.03% by the end of July, dragging on this factor’s return due to its short position.9
Exhibit 5: U.S. and Japanese 10-Year Bond Yields in July
Data sourced from Bloomberg
It is worth noting that Foreign Exchange Carry and Fixed Income Carry are orthogonalized to our Equity and Interest Rate factors, respectively. They are also volatility-scaled. In July, the raw input for FX Carry was down -12.35%, while FI Carry was down -3.47%.

References
1 This factor is orthogonalized to Equity, Interest Rates, and Commodities.
2 Source: Bloomberg
3 The typical tech positioning for Momentum and Crowding are a little less straightforward. Momentum is a chameleon factor, adjusting positioning based on relative equity performance trends. Crowding utilizes residual short interest to capture aggregate investor views above and beyond existing equity styles. This makes its sector positioning much less predictable.
5 Notably, some of Tech’s outperformance on this final day likely has to do with it having a beta greater than one to our Equity factor. For example, over the last three years it has had a beta of roughly 1.27. Using some back of the envelope math, a 1.4% rally in our Equity factor on the last day of the month would suggest a roughly 1.8% return for tech based on its Equity beta. Tech’s outperformance above and beyond this on the last day of the month was likely driven by other factors, likely including a tech sector specific return that benefited from AMD’s earnings release.
7 Source: Bloomberg
9 Source: Bloomberg
References to the Two Sigma Factor Lens and other Venn methodologies are qualified in their entirety by the applicable documentation on Venn.
This article is not an endorsement by Two Sigma Investor Solutions, LP or any of its affiliates (collectively, “Two Sigma”) of the topics discussed. The views expressed above reflect those of the authors and are not necessarily the views of Two Sigma. This article (i) is only for informational and educational purposes, (ii) is not intended to provide, and should not be relied upon, for investment, accounting, legal or tax advice, and (iii) is not a recommendation as to any portfolio, allocation, strategy or investment. This article is not an offer to sell or the solicitation of an offer to buy any securities or other instruments. This article is current as of the date of issuance (or any earlier date as referenced herein) and is subject to change without notice. The analytics or other services available on Venn change frequently and the content of this article should be expected to become outdated and less accurate over time. Two Sigma has no obligation to update the article nor does Two Sigma make any express or implied warranties or representations as to its completeness or accuracy. This material uses some trademarks owned by entities other than Two Sigma purely for identification and comment as fair nominative use. That use does not imply any association with or endorsement of the other company by Two Sigma, or vice versa. See the end of the document for other important disclaimers and disclosures. Click here for other important disclaimers and disclosures.