
Life decisions sometimes require a single question: “What’s the worst that can happen?” Depending on the answer, one may continue, alter, or abandon their plan, weighing the worst-case scenario against its likelihood. This exercise can be a powerful tool for managing risk.
In the world of private investments, the worst-case scenario is often associated with defaulting on capital calls or funding failure–essentially, not having the liquid funds to pay private asset managers what investors contractually agreed to. This can spell both financial and reputational disaster for an investment plan. Venn’s cash flow modeling can help manage this risk by projecting cash flows into the future.
While evaluating private assets on their own is useful, it's also important to consider that many investors have a public (liquid) portion of their portfolio. This liquidity sleeve can be utilized for both strategic and tactical funding, providing support to an overall investment strategy.
The question then becomes: “How can investors understand the probability of funding failure in a combined private and public asset portfolio?” And even further: “How can investors assess the changing composition of this portfolio to maintain their desired asset allocation?”
Going Beyond Mental Math via Data-Driven Risk Assessment
Many prudent investors may utilize a liquidity sleeve when allocating to private assets. This approach provides funding potential beyond the distributions from private investments alone. Ideally, having a liquidity sleeve brings flexibility and stability to both the private investment process and an overall investment strategy.
Exhibit 1: The Role of a Liquidity Sleeve in Funding Private Assets
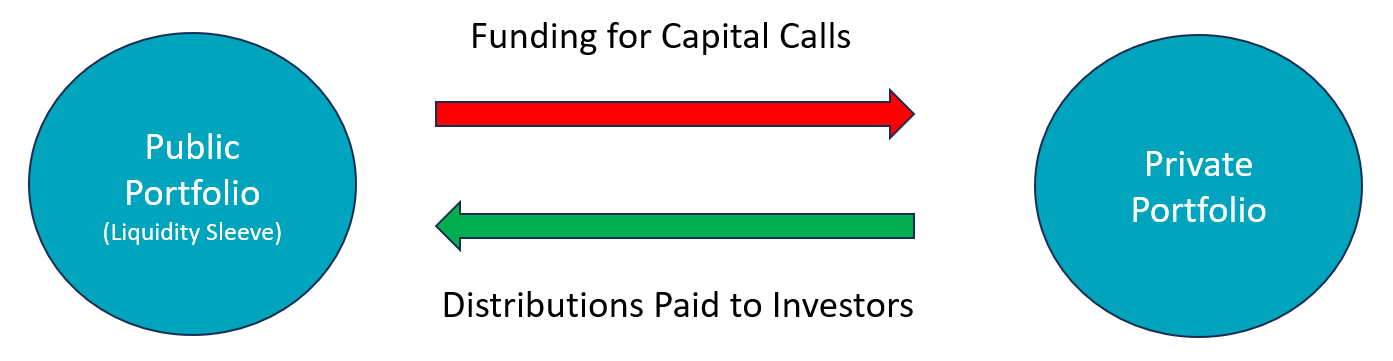
Source: Venn by Two Sigma. For illustration purposes only.
Given the complexities of managing both public and private assets, we need to go beyond the “worst-case scenario mental math” that we typically use in our day-to-day lives. Instead, we can use data-driven risk assessment to measure the probability of funding failure. Specifically, the modeling process can be thought of as two distinct methodologies working together:
- Public Portfolio: Two Sigma’s Factor Lens is used to generate a forecasted return and volatility. Monte Carlo simulations are then used to explore a myriad of possible future scenarios.
- Private Portfolio: Future cash flows and net asset values are modeled using fund-specific inputs alongside calibrated model parameters.1
Remember, when we imagine worst-case scenarios we typically consider them alongside the likelihood of them occurring. Without that second step, practical decisions can fall victim to the most improbable outcomes, such as asteroids or alien invasions. By running hundreds of thousands of possible paths for our public sleeve via Monte Carlo simulations, we can model the likelihood of funding failure for a portfolio of private and public assets.
Simulating Growth and Funding Failure for a Public and Private Portfolio
Before diving into the total portfolio, let’s start with context for just the private side. In Exhibit 2, we model the net cash flow for a $25 million commitment to an anonymous vintage 2021 private equity fund. Since we are modeling a single fund, we expect a natural J-curve pattern due to negative cash flows in the beginning of the period (more capital being called) and positive net cash flows later on (more distributions being made).
Exhibit 2: Historical and Projected Net Cash Flows for our Hypothetical portfolio Allocation
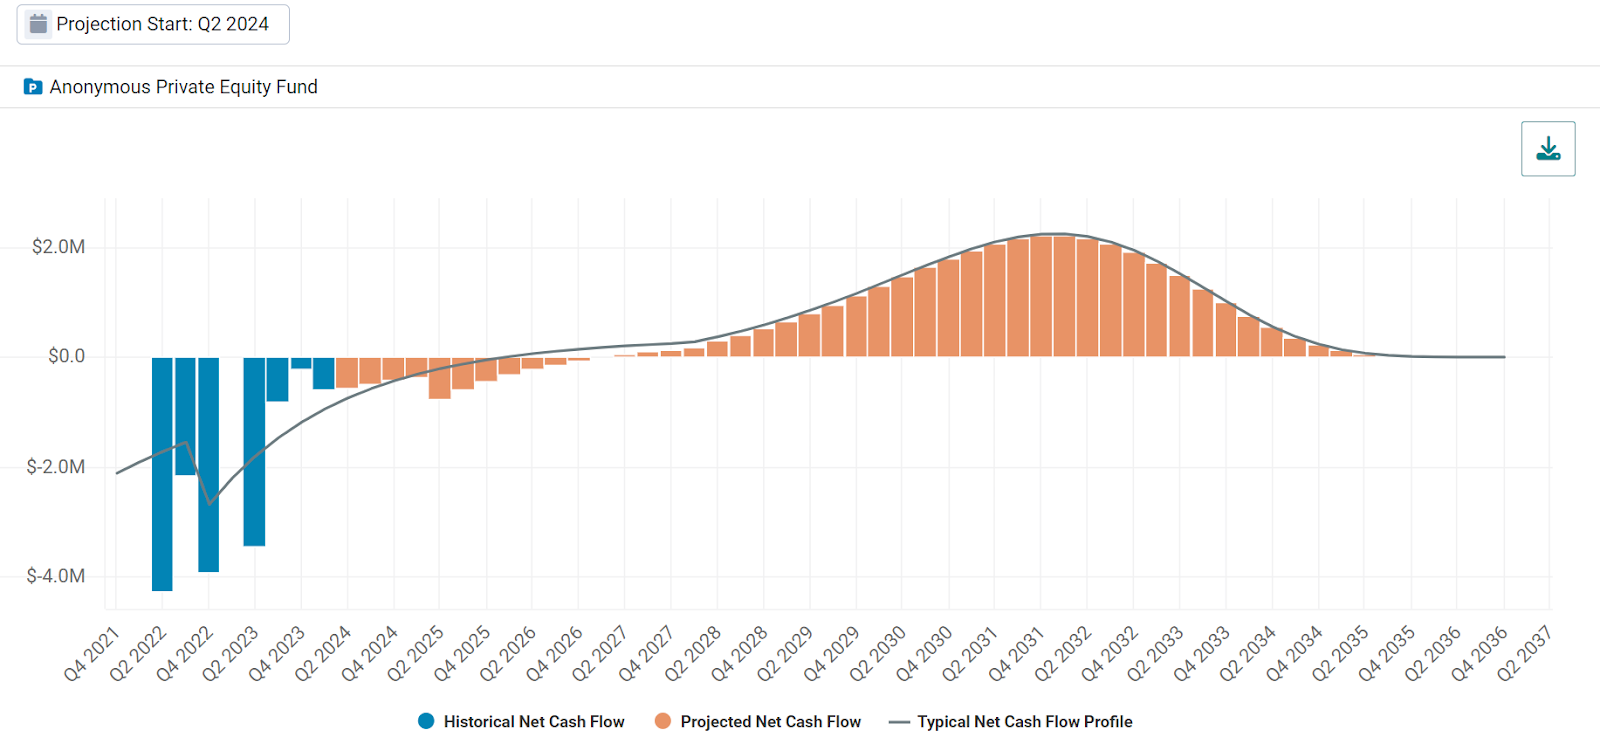
Source: Venn by Two Sigma
Whether it’s a vintage diversified portfolio or a single fund, a negative historical or projected net cash flow indicates when a liquidity sleeve could be used to cover the shortfall. For example, in Exhibit 2, quarter-by-quarter cash flow projections are negative until Q1 2027. This means additional liquidity would be needed outside of this portfolio's projected distributions for each of those quarters.
Adding in Liquidity Sleeve Simulations
Let’s say that we have a $5 million liquidity sleeve of public equities to facilitate the funding of our $25 million private asset commitment. More specifically, we use the iShares Russell 2000 ETF since its higher volatility makes for a wider range of outcomes.
In Exhibit 3, we show the 99th (best case scenario), 50th (median), and 1st percentiles (worst case scenario). Notably, these outcomes account for potential growth of the liquidity sleeve as well as potential capital calls and distributions of the private asset sleeve (the relationship shown in Exhibit 1). They represent total portfolio asset growth simulation. Notice that our worst-case scenario stops in Q4 2025 when capital calls cannot be funded by our liquidity sleeve.
Exhibit 3: Asset Growth Percentiles for Public and Private Investments
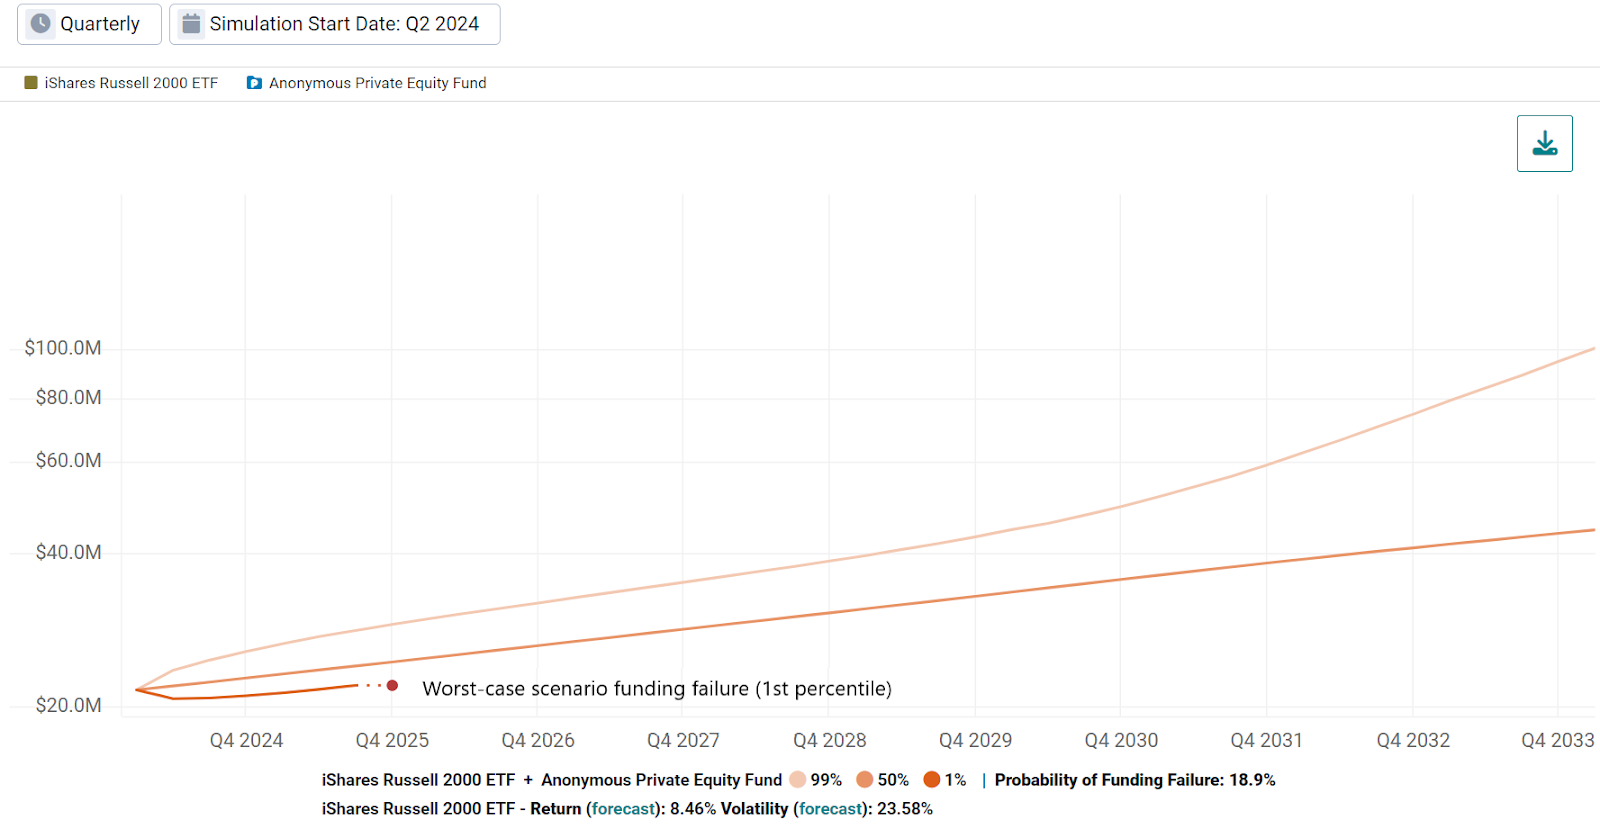
Source: Venn by Two Sigma
Identifying the 1st percentile may seem like a final answer; it’s basically as bad as it’s expected to get. But as we mentioned earlier, a practical interpretation of a worst-case scenario includes its likelihood.
Referring to the legend of the chart, we see that 18.9% of simulations experienced funding failure, not just the 1st percentile. This is interpreted as an 18.9% probability of funding failure broadly.
To visualize this further, we included the 15th percentile in Exhibit 4. We already know this percentile experiences funding failure since it falls below 18.9%. However, the failure occurs nearly two years later than the 1st percentile, since we expect this simulation to experience relatively better growth. When we hover over it in Venn we include a description of expected capital calls and distributions, as well as the value of the liquidity sleeve at the time of funding failure. In this example, our liquid portfolio was valued at around $42,000 when roughly $131,000 of capital was needed (capital called minus distributions).
Exhibit 4: Funding Failure for the 15% Percentile of Our Hypothetical Portfolio
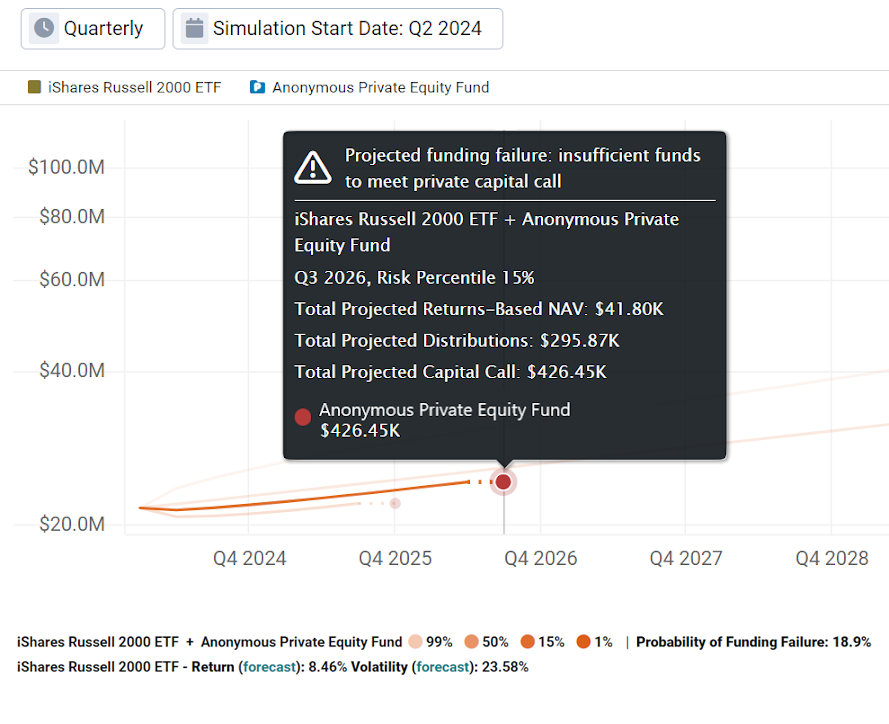
Source: Venn by Two Sigma
Translating Insights Into a Thoughtful Investment Strategy
An allocator has a variety of choices that can be made with this information. For example, if a roughly 19% probability of funding failure is too high, they could sell funds calling for capital in the secondary market. A more practical approach may be to increase the starting value of the liquidity sleeve, or change the riskiness of the assets being used within it.
Regarding this point, to evaluate the risk associated with different liquidity sleeves we analyzed the use of the iShares 0-3 month Treasury Bond ETF instead of our original version using the Russell 2000 ETF (Exhibit 5). Note that the probability of funding failure for each is also detailed in the legend.
Exhibit 5: Evaluating How The Risk of a Liquidity Sleeve Can Affect Both Growth and Funding Failure
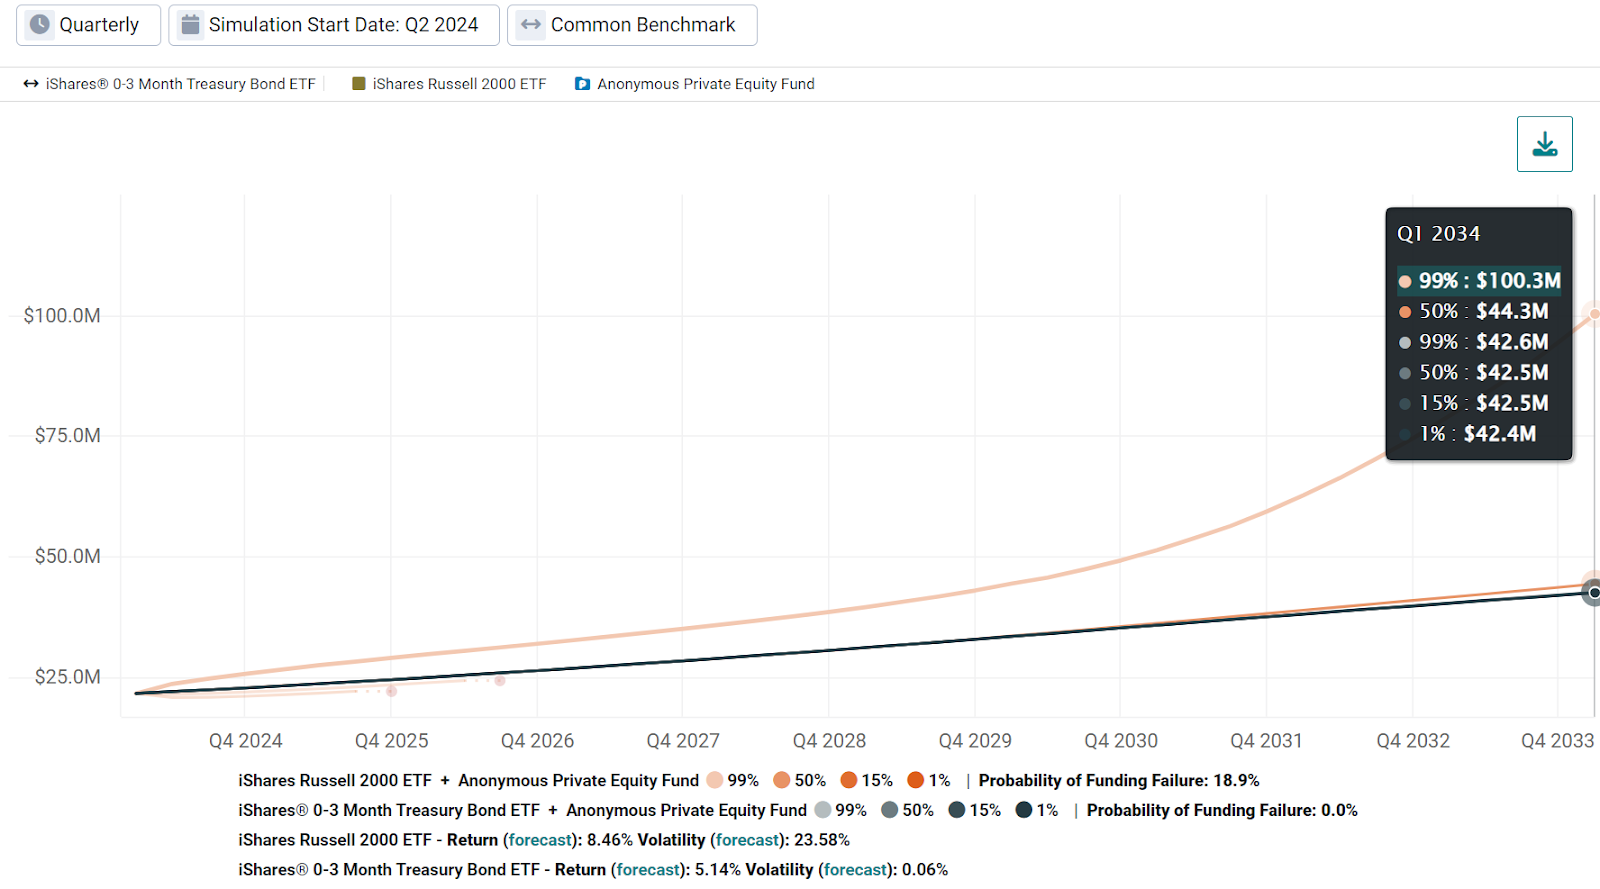
Source: Venn by Two Sigma
As we discussed earlier, using the Russell 2000 ETF as our liquidity sleeve yields a 18.9% probability of funding failure, but a best-case scenario ending NAV of around $100 million in 10 years. The best-case scenario for the short-term Treasury ETF as our liquidity sleeve results in a total portfolio value of $43 million in 10 years, but with 0% probability of funding failure. Notably, the median outcome is quite similar for both approaches, but again, the cash proxy is projected to have no possibility of funding failure.
This is a classic trade-off between risk and reward, but now viewed through the lens of projected asset growth and the probability of funding failure for a total portfolio. Depending on the investment plan or investor risk tolerance, this type of analysis might significantly affect commitment strategies, funds set aside for liquidity, or the risk profile of the public portfolio.
Balancing Act: Maintaining a Consistent Private Asset Allocation
The benefits to using this type of total portfolio modeling goes beyond understanding the probability of funding failure. It can also help model asset allocation between private and public investments.
Let’s say, for example, that our total portfolio targets around 85% in privates and 15% in public investments. Using the median percentile (or whichever percentile you choose), we can track when our private allocation is projected to exceed or fall short of this target.
Exhibit 6: Modeling the Changing NAV for a Private and Public Allocation Over Time. (85% Private Allocation Target Using the 50th Percentile)
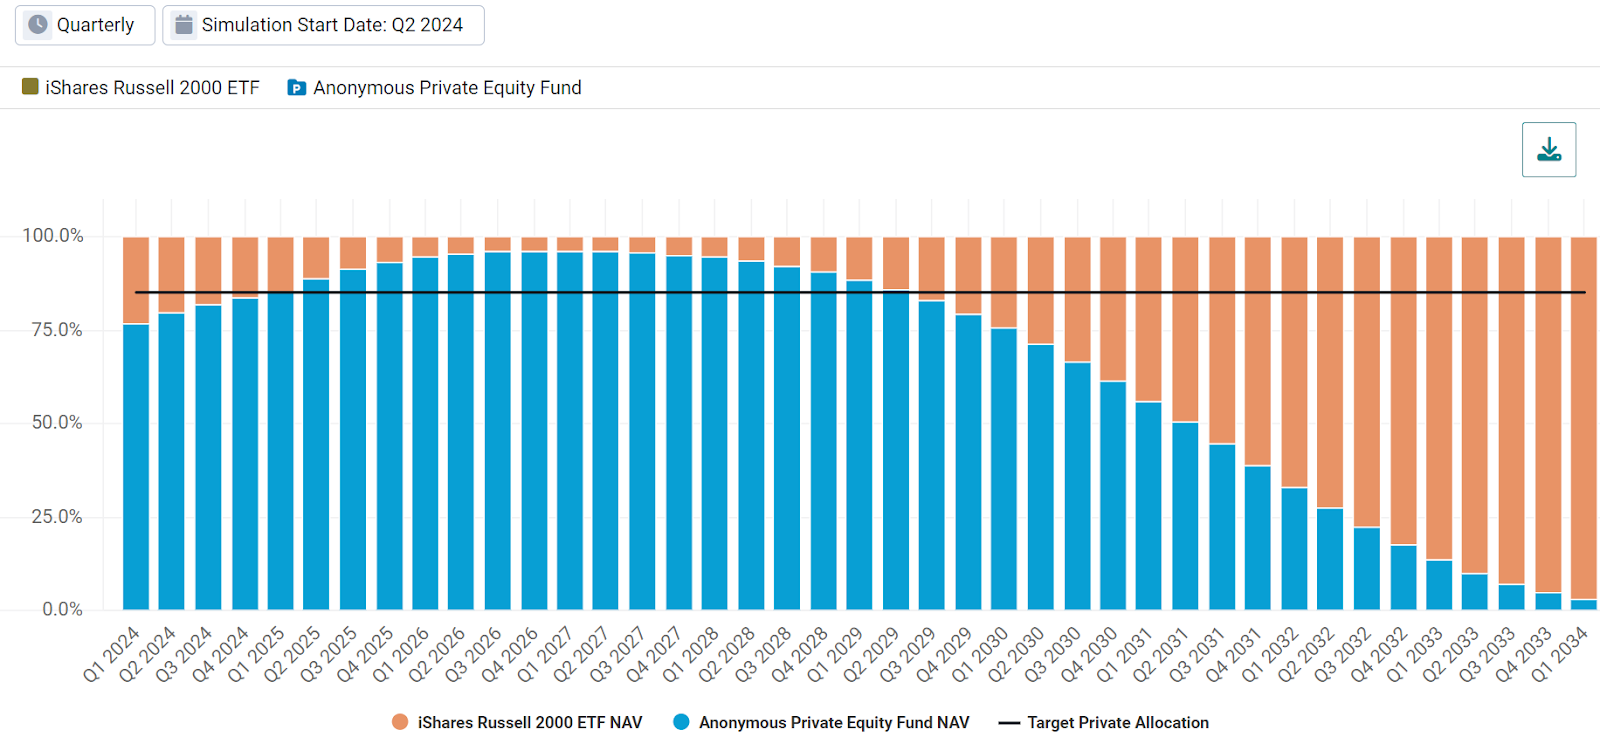
Source: Venn by Two Sigma
Here we show that we may reach an 85% allocation to privates in Q1 2025. However, we might then be over-allocated until Q2 2029.
After this period, our private asset continues its distributions and thus lowers its NAV. This highlights the importance of an informed recommitment strategy to maintain the desired private asset allocation. Without newer private funds to commit capital to, our public sleeve begins to dominate our allocation and eventually comprises almost 100% of our total portfolio in 10 years.
Turning Funding Failure Worries into Data-Driven Decisions
Venn’s original mission was to employ factor analysis to deliver holistic, intuitive, and impactful insights for clients’ complex multi-asset portfolios. This approach included a comprehensive analysis of holdings related to hedge funds, equities, fixed income, commodities, and more. Until recently, it didn’t address the specialized needs of illiquid private assets. As interest in private assets grew, our clients expressed a need for holistic portfolio analysis to encompass these assets as well. This led us to release features such as desmoothing and public market equivalents, empowering users to mark their private assets to the market and conduct apples-to-apples performance comparisons. Venn’s new Private Asset Lab (PAL) offers these features and more.
Yet, clients continued to grapple with a fundamental question: “What’s the worst that can happen?” This question is pivotal in risk management, particularly when balancing the liquidity needs for illiquid assets. With the launch of our total portfolio asset growth simulation, we believe we are addressing this concern head-on.
Our goal remains to equip clients with the tools they need to achieve better investment outcomes. In line with market trends, purpose-built analytics for private and public assets are a top priority, ensuring that our clients can navigate the complexities of their holistic portfolios with context, transparency, and confidence.
Exposure to risk factors is not a guarantee of increased performance or decreased risk. Past performance does not guarantee future results.
Private asset portfolios are less liquid than public asset portfolios and have additional risks, including the risk of loss.
Certain data provided by Preqin Ltd. Copyright 2024 Preqin Ltd. All rights reserved.
Cash flow modeling is dependent on assumptions of uniform fund behaviors according to fund characteristics, and historical data availability. The future cash flow timing and needs of specific investments will differ from the model results, at times significantly.
Desmoothing, extrapolation, and interpolation use historical data and relationships among proxies to make estimates. These estimates will not always predict future results and have inherent limitations. Cash flow modeling is dependent on assumptions of uniform fund behaviors according to fund characteristics, and historical data availability. The future cash flow timing and needs of specific investments will differ from the model results, at times significantly.
References
1 Inputs can include fund start time stamp, as of date time stamp, capital committed, net asset value as of when projections start, and paid-in capital as of when projections start. Applied parameters to this data include rate of contribution, fund life expectancy, a factor describing changes in the rate of distribution over time, quarterly yield (%), and quarterly growth rate (%).
References to the Two Sigma Factor Lens and other Venn methodologies are qualified in their entirety by the applicable documentation on Venn.
This article is not an endorsement by Two Sigma Investor Solutions, LP or any of its affiliates (collectively, “Two Sigma”) of the topics discussed. The views expressed above reflect those of the authors and are not necessarily the views of Two Sigma. This article (i) is only for informational and educational purposes, (ii) is not intended to provide, and should not be relied upon, for investment, accounting, legal or tax advice, and (iii) is not a recommendation as to any portfolio, allocation, strategy or investment. This article is not an offer to sell or the solicitation of an offer to buy any securities or other instruments. This article is current as of the date of issuance (or any earlier date as referenced herein) and is subject to change without notice. The analytics or other services available on Venn change frequently and the content of this article should be expected to become outdated and less accurate over time. Two Sigma has no obligation to update the article nor does Two Sigma make any express or implied warranties or representations as to its completeness or accuracy. This material uses some trademarks owned by entities other than Two Sigma purely for identification and comment as fair nominative use. That use does not imply any association with or endorsement of the other company by Two Sigma, or vice versa. See the end of the document for other important disclaimers and disclosures. Click here for other important disclaimers and disclosures.