2024 Two Sigma Factor Lens Performance Report
As a quick refresher, Venn’s Two Sigma Factor Lens is comprised of four categories: Core Macro, Secondary Macro, Macro Styles, and Equity Styles. The first two categories typically explain risk across asset classes, whereas Style factors focus on risk within them. Our factor lens operates using a tier system, consolidating overlapping risks into higher tier factors, of which the highest two are Equity and Interest Rates.
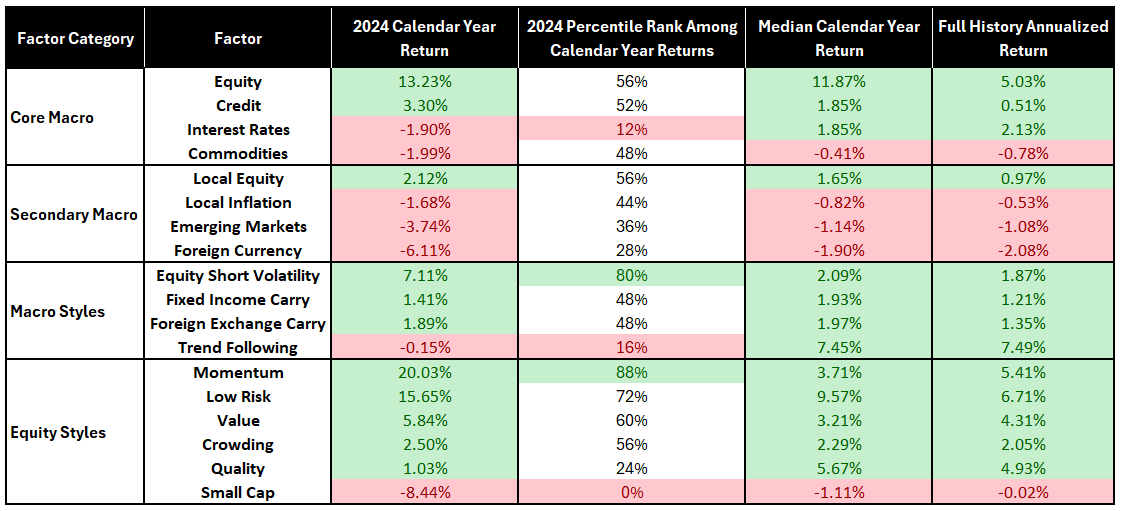
Exhibit 1 highlights 2024 performance, with positive values in green and negative values in red. To gauge the historical significance of 2024, the fourth column is a percentile rank among other calendar years for each factor. Here we highlighted the value in green if it was in the top 20%, or red in the bottom 20%. (You can click on exhibits to enlarge them).
Exhibit 1: Two Sigma Factor Lens Performance, Calendar Year 2024
Source: Venn by Two Sigma as of 12/31/2024. Full history from 8/7/1998 to 12/31/2024.
Factors That Caught Our Eye in 2024:
Equity Styles
For context, our Equity Styles are global,1 long/short, and beta-neutral. You can read more about our methodology here.
Low Risk and Momentum: These two factors delivered strong performance in 2024, rewarding investors with exposure to them. Momentum was particularly noteworthy as it achieved a calendar year return in the 88th percentile across 26 years of data.
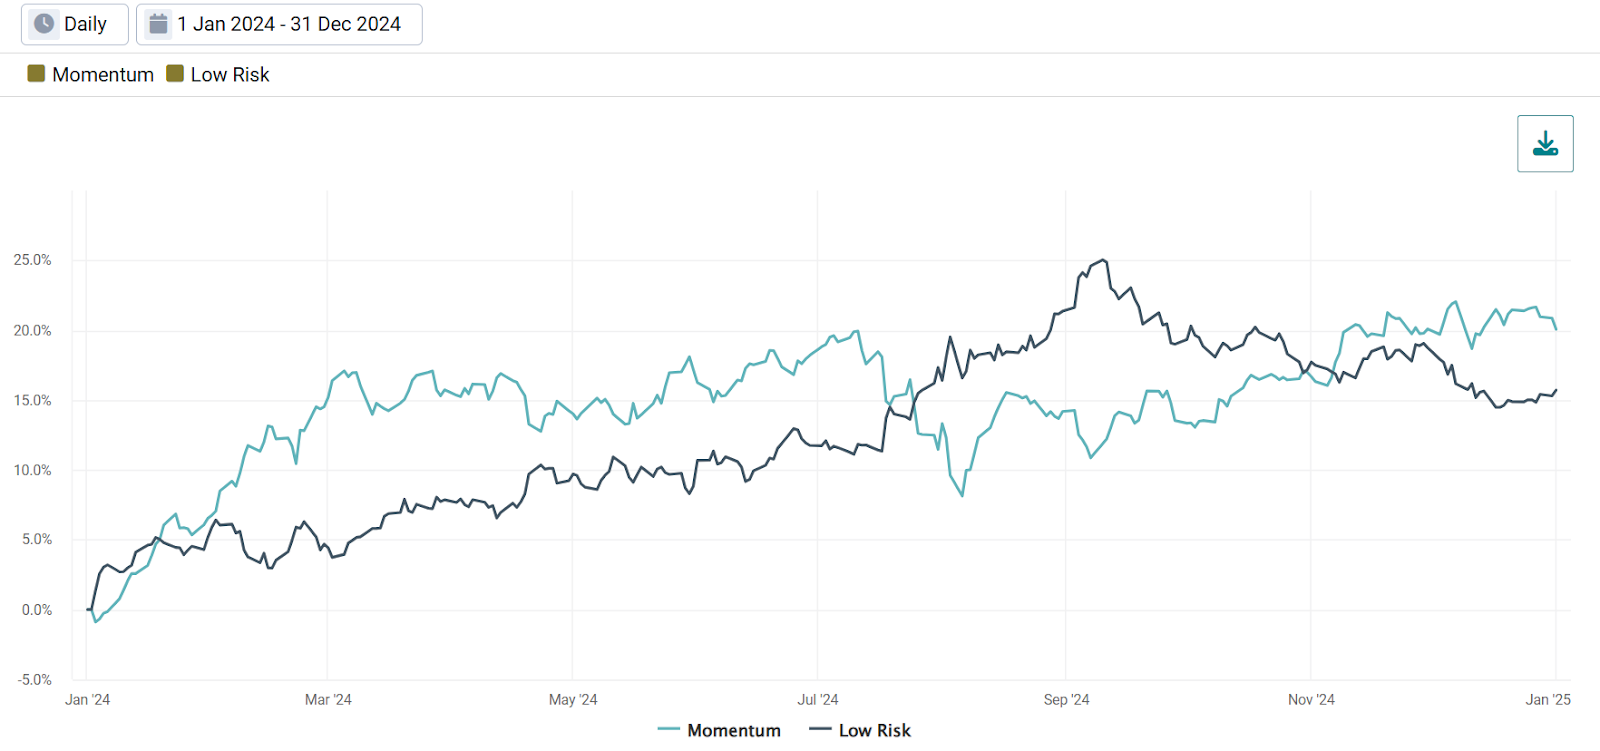
Perhaps more interesting than their individual performance was how both styles achieved strong returns despite their clear differentiation. For example, one can observe a clear negative correlation by simply looking at their 2024 cumulative returns.2
Exhibit 2: Low Risk and Momentum 2024 Cumulative Return
Source: Venn by Two Sigma.
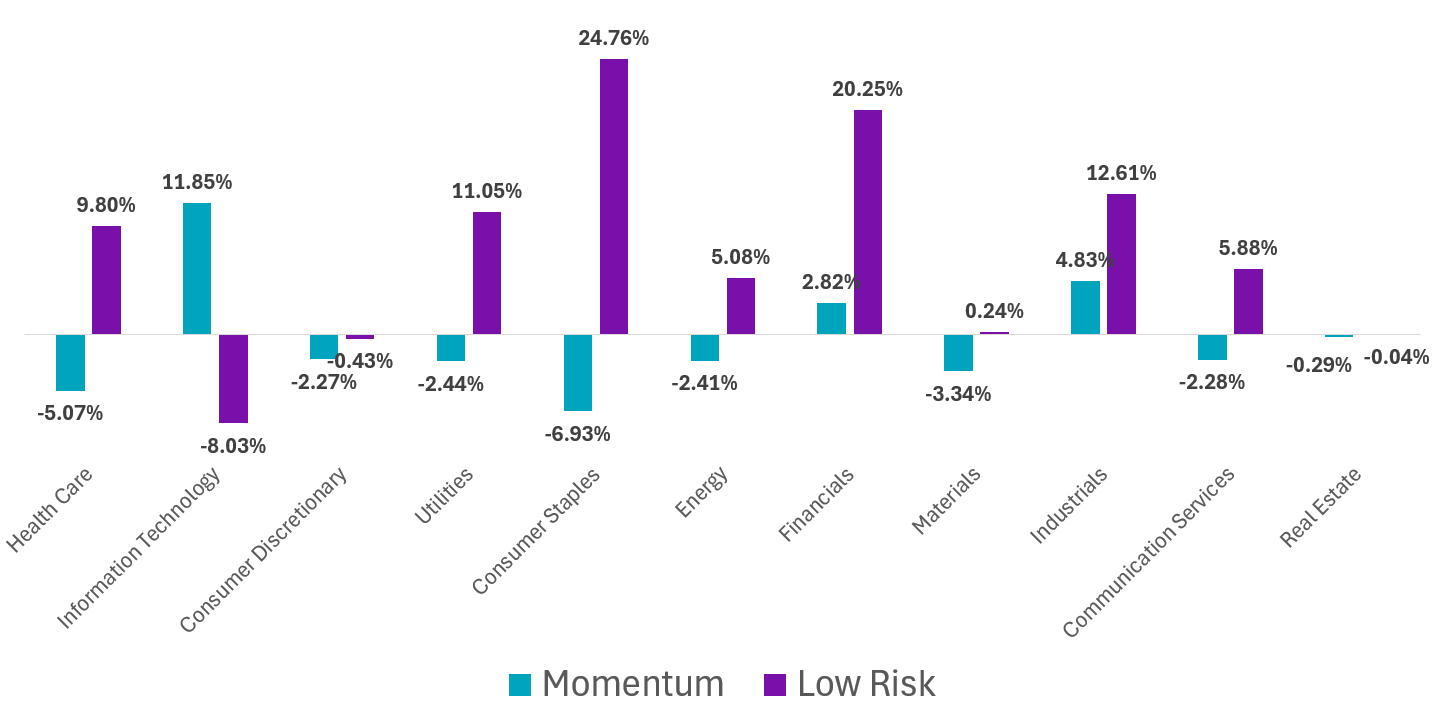
Visualizing each factor’s average net sector positions for the year confirms their ability to generate positive returns alongside differentiation. As we can see below, they had opposite positioning in seven out of eleven sectors.
Exhibit 3: Average Net Sector Weight for Momentum and Low Risk in 2024
Source: Venn by Two Sigma.
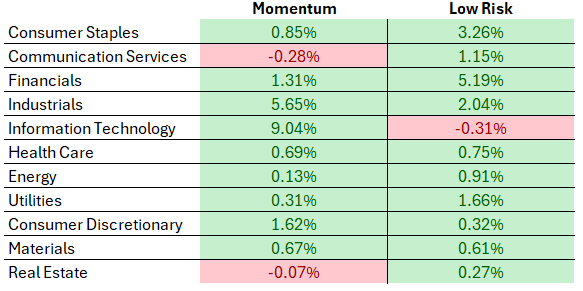
Despite this different positioning, below we see that contribution to return from each sector was generally positive for both factors.
Exhibit 4: 2024 Contribution to Return by Sector for Momentum and Low Risk
Source: Venn by Two Sigma.
- Momentum gained most of its value from Information Technology, while Low Risk mainly benefitted from Financials.
- Neither style experienced significant negative contributions from any sector, including where they held net short positions.
- Using our factor definitions, this demonstrates the broad accessibility of these systematic risk premia to investors in 2024.
Small Cap: Market participants often assess “small cap” performance through popular U.S. exposures such as the iShares Russell 2000 ETF (IWM). This long-only equity exposure gained meaningful attention in November due to Republicans winning the White House alongside a unified government. Tailwinds were centered around tax cuts, deregulation, and an America-first mindset.
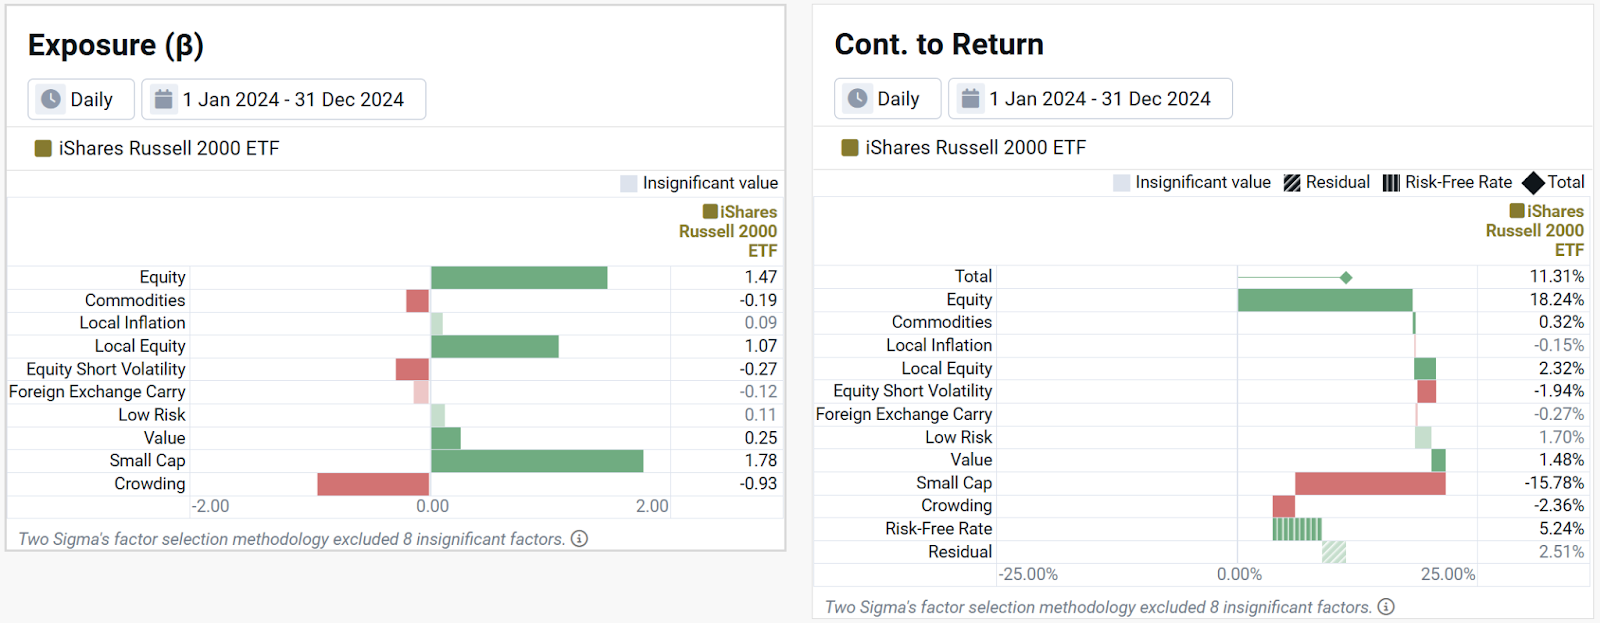
On the surface, U.S. small caps stocks - measured by this Russell 2000 ETF - rose 11.3% in 2024. However, our global Small Cap factor experienced its worst calendar year on record. It turns out, various factors contributed to the Russell 2000’s positive return in 2024, but our Small Cap factor was not one of them.
This is an ideal opportunity to decompose the Russell 2000’s exposure and returns using the Two Sigma Factor Lens. We believe that applying the Two Sigma Factor Lens, rather than just reporting on factor performance, best highlights its core pillars: holistic, parsimonious, orthogonal, and actionable.
Exhibit 5: 2024 Factor Contribution to Exposure and Return of a Russell 2000 ETF
Source: Venn by Two Sigma.
- Exhibit 5 (right-hand side) shows that almost 20% of the Russell 2000's return was driven by its high beta to our Equity factor, with additional gains being driven by its U.S. equity market focus via Local Equity.
- Also, let's not forget the 5.24% return of the risk-free rate, as our factor analysis measures performance beyond this baseline.
- Conversely, its exposure to our global Small Cap factor significantly detracted from returns, around -16%. This underscores how an asset class versus factor understanding can tell different stories, with factor analysis typically isolating independent and fundamental drivers of return.
- Our factor lens indicates that the Russell 2000’s positive performance was largely driven by high exposure to the equity risk premium, including U.S. specific equity markets. Not tailwinds specific to small caps.
Macro Styles
Among Macro styles, both Trend Following and Equity Short Volatility experienced notable calendar year returns relative to their history.
Trend Following: This factor aims to capitalize on trends in asset classes by going long or short various futures based on their directional performance.
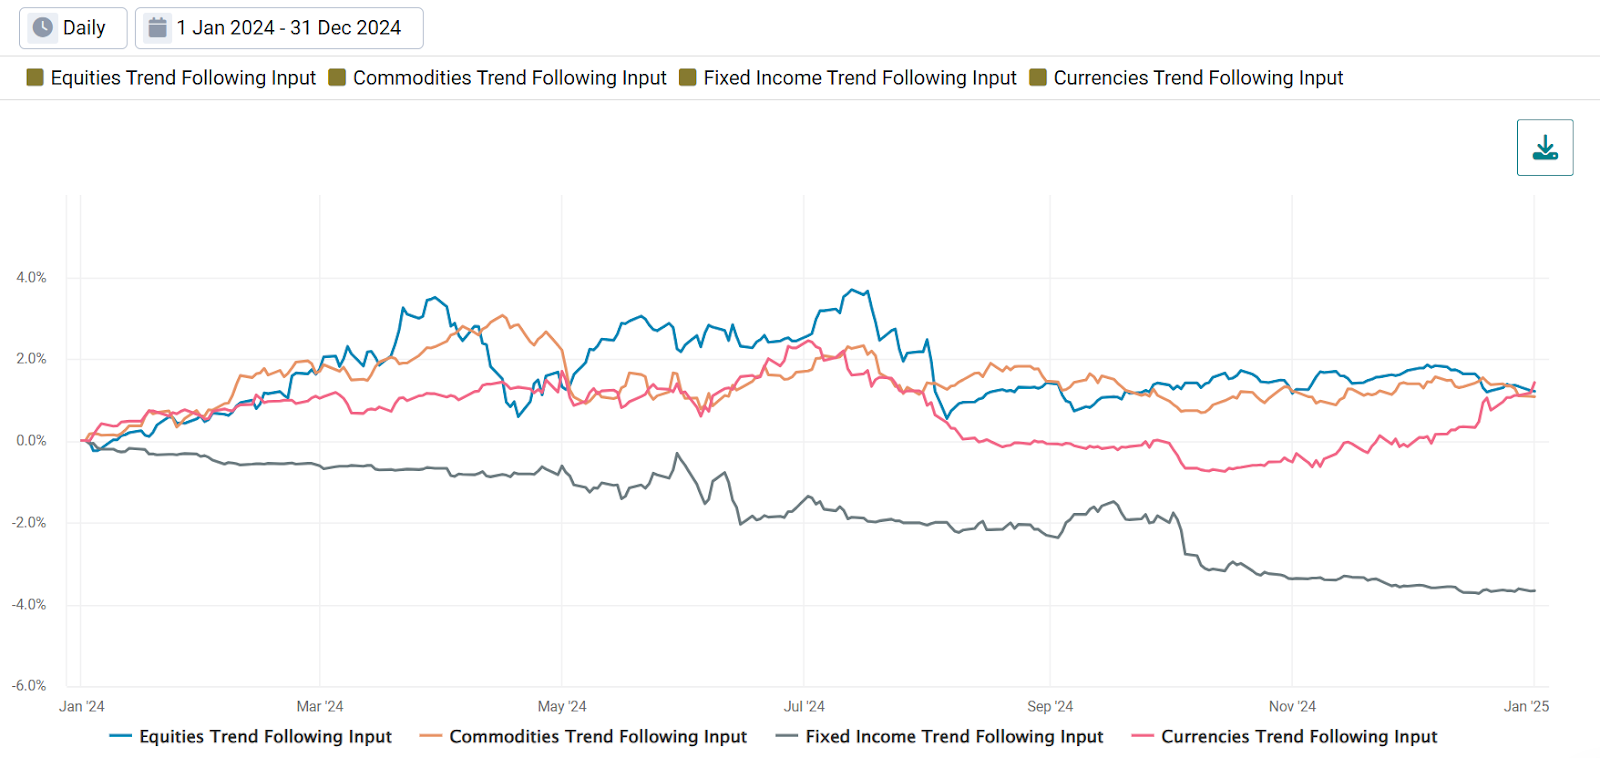
While Trend Following was only slightly negative in 2024, performance was in the bottom 16th percentile. This is because over 26 years of data, this is only the fifth time it has posted a negative calendar year return. Of its four sleeves, only fixed income contributed negatively.
Exhibit 6: Contribution to Trend Following Return of Individual Sleeves
Source: Venn by Two Sigma.
- Underperformance of the fixed income sleeve suggests that trends within this asset class were less consistent than the other three in 2024. As a result, fixed income trend following struggled to generate positive returns.
- When taking a bottom up approach like our Trend Following factor, declining asset class volatility does not necessarily mean more stability in the underlying futures.
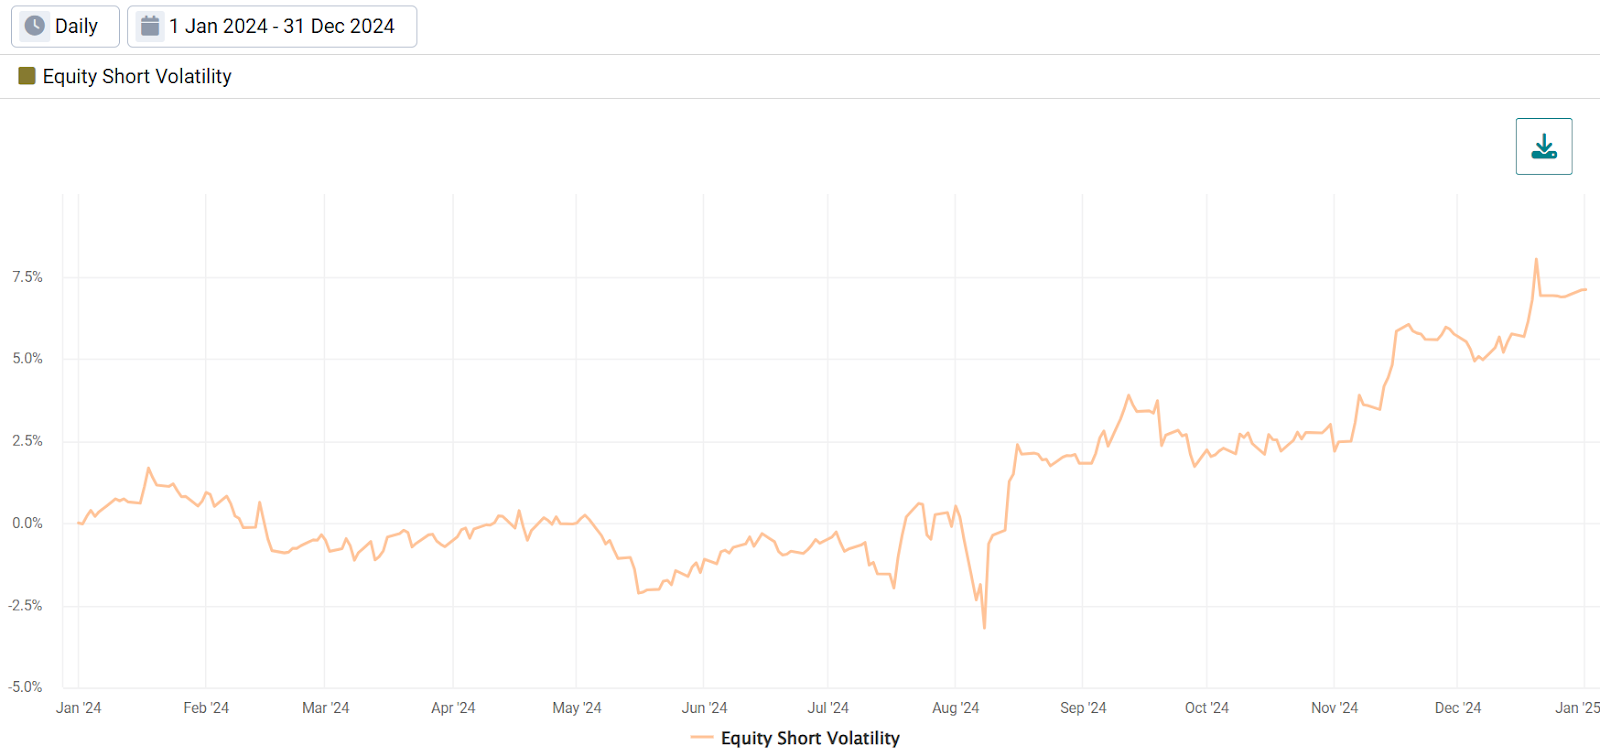
Equity Short Volatility: 2024 performance for this factor ranked in the top 80% among its calendar years.
Despite its name, this factor attempts to capture short volatility exposure above and beyond our Equity factor and the risk-free rate. Shorting volatility resembles insurance: premiums are collected when volatility is low, but payouts are required when volatility spikes. Its positive return indicates that investors were compensated for providing this insurance beyond what would be captured in movements of our Equity factor.
Exhibit 7: Equity Short Volatility Cumulative Return
Source: Venn by Two Sigma
- Most of Equity Short Volatility’s positive return occurred in the second half of the year, accelerating as the presidential election approached and concluded.
- Previous research of our Equity factor showed that volatility tends to be elevated before a presidential election, but declines as the election nears, and typically continues to fall afterward.
- It may be the case that volatility above and beyond our Equity factor experienced a similar theme as election uncertainty diminished.
Secondary Macro Factors
Emerging Markets (EM) and Foreign Currency factors were among the worst performers relative to their historical calendar year performance.
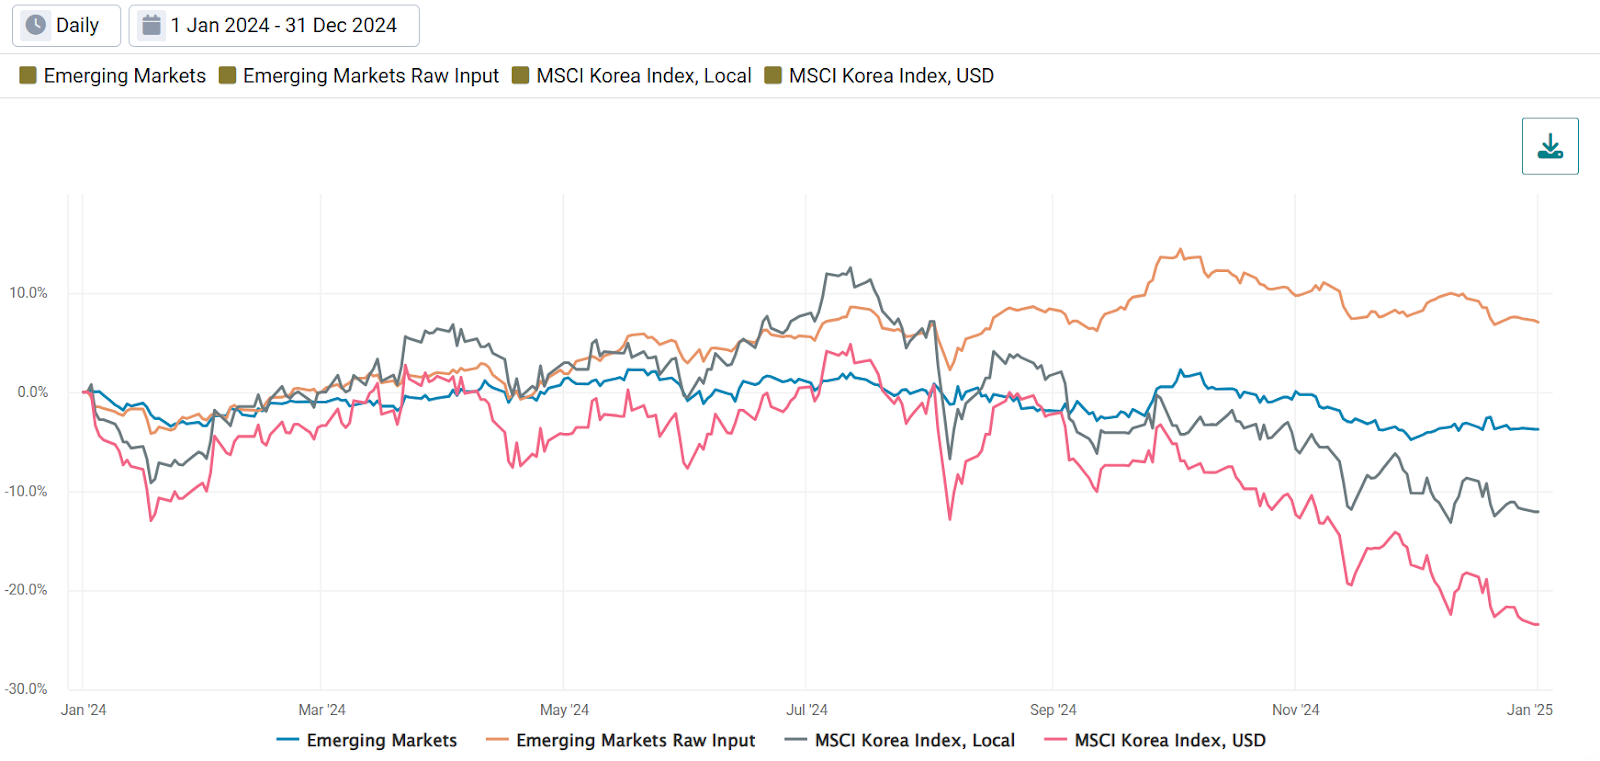
Emerging Markets factor: The raw input for our EM factor is composed of 67% equities and 33% debt. This input was up 7.03% in 2024. However, our currency-hedged EM factor, adjusted for exposure to Equity, Credit, Interest Rates, and Commodities factors, declined by 3.74%. A meaningful contributor to EM headwinds in 2024 was exposure to South Korea.
Exhibit 8: Emerging Markets and South Korea Cumulative Return
Source: Venn by Two Sigma, Bloomberg.
- South Korea comprises approximately 10% of the equity exposure for broad market-cap weighted EM. In 2024, this country’s equity market declined -23.36% in USD or -12.03% in local terms.3
- August 5th, or “Black Monday”, marked the beginning of Korea’s significant end-of-the-year decline. On that day, Korean equity markets fell 9.5% in USD or 9.2% measured in the local currency.4
- A variety of explanations exist for the South Korean market rout to end the year, including fears over a U.S. recession, an AI bubble given their semiconductor heavy market,5 political instability highlighted by the brief declaration of martial law, or the recent tragedy surrounding Jeju Air.6
- An interesting note on South Korea is that, despite its sizable market capitalization, it is sometimes included in EM exposure and sometimes not. Given it is around 10% of market-cap weighted EM, significantly differentiated performance, such as its negative performance in 2024, can make a noticeable impact for allocators.
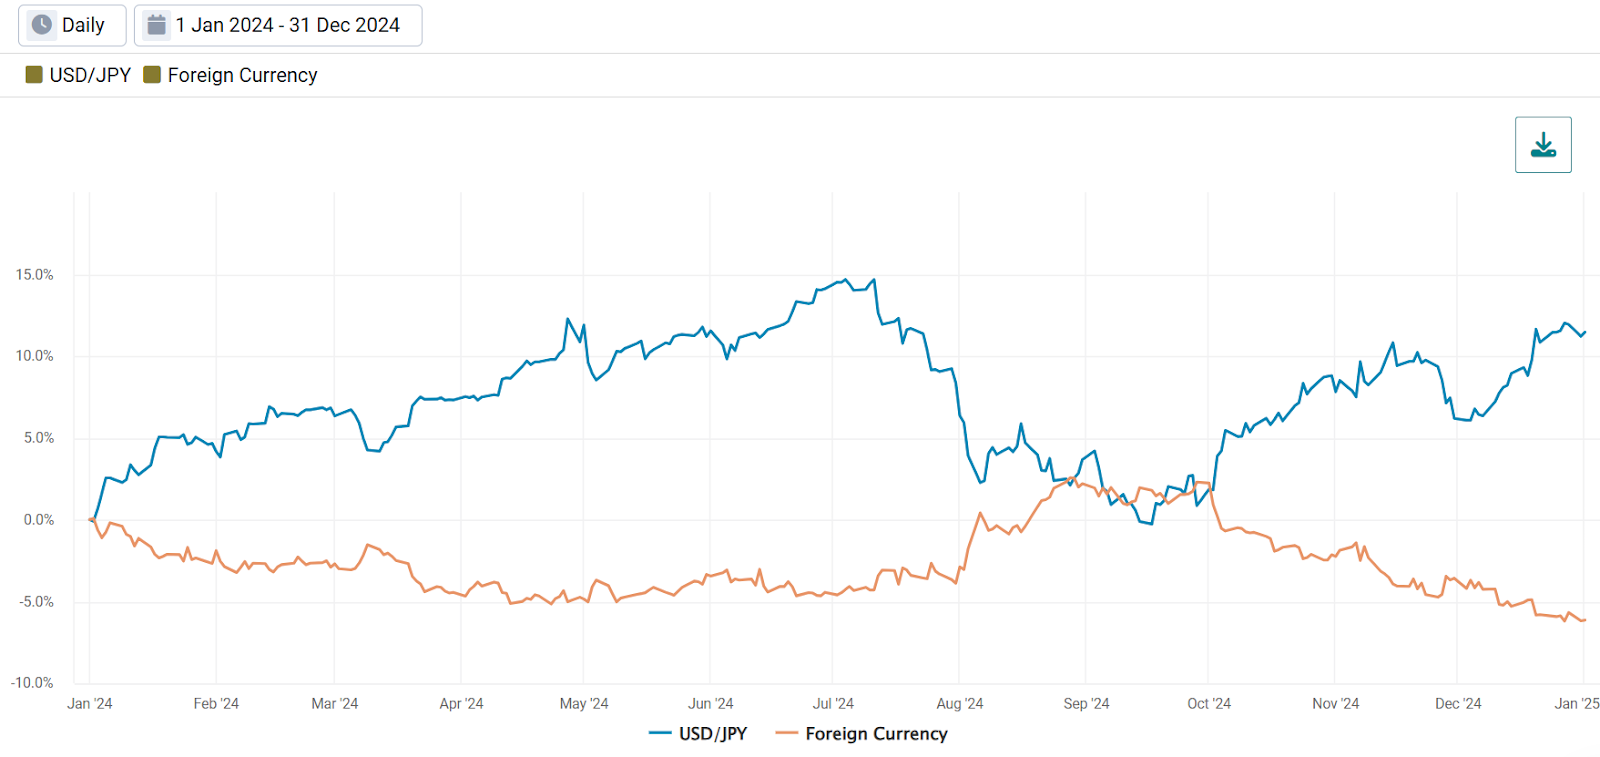
Foreign Currency factor: This factor was significantly negative in 2024, reflecting the U.S. Dollar's appreciation against a basket of G10 currencies, after accounting for exposure to entangled factors such as Equity, Interest Rates, Credit, and Commodities.
Dollar strength was partly driven by the Fed giving slower-than-expected rate cut guidance throughout the year, as well as the USD receiving a late-year tailwind from anticipated pro-growth Republican policies.
Exhibit 9: Foreign Currency Factor Cumulative Return and the USD to JPY Currency Pair
Source: Venn by Two Sigma and Bloomberg.
- A notable exception to USD strength was around July, when the USD sharply depreciated against G10 currencies and our Foreign Currency factor rallied as a result. In fact, this move was so profound that our July and August monthly reports focused on our Foreign Currency (and FX Carry) factor.
- In those reports, we wrote about the Fed discussing the rate-cutting cycle, while the BOJ simultaneously hiked their short-term policy rate. This contributed to the unwinding of the USD to JPY carry trade and the JPY's substantial strengthening against the USD.
Core Macro Factors: Among Equity, Interest Rates, Credit, and Commodities factors, only the Interest Rates factor stood out in 2024, ranking in the bottom 12% of its calendar year returns.
To set the stage, our Interest Rates factor provides straightforward exposure. It is the return of currency hedged 7-10 year global sovereign bonds, above and beyond the risk-free rate. As a tier 1 factor in our lens, interest rate risk found throughout a multi-asset portfolio should show up in this factor when conducting factor analysis. It is not orthogonalized against any other factors.
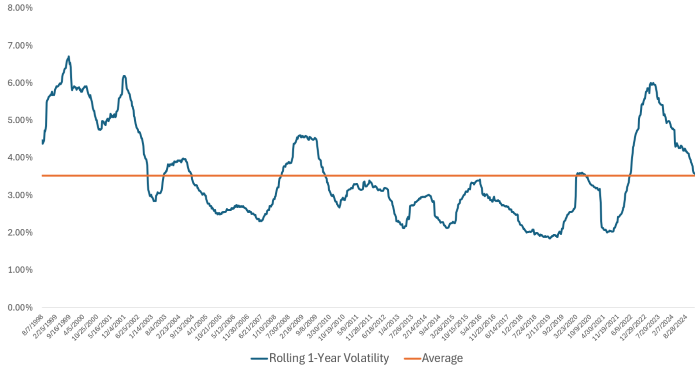
- While one might expect global monetary policy uncertainty to increase bond volatility, volatility has actually decreased alongside cooling inflation (Exhibit 10).
- In fact, diverging global monetary policies may have contributed to diversification and lower risk by reducing correlations between different regions’ bond markets.7
- The trailing 1-year volatility of our Interest Rates factor as of 12/31/2024 (aka 2024 volatility) is now in line with its historical average.
Exhibit 10: Interest Rates Factor Rolling 1-Year Volatility, 1998–2024
Source: Venn by Two Sigma.
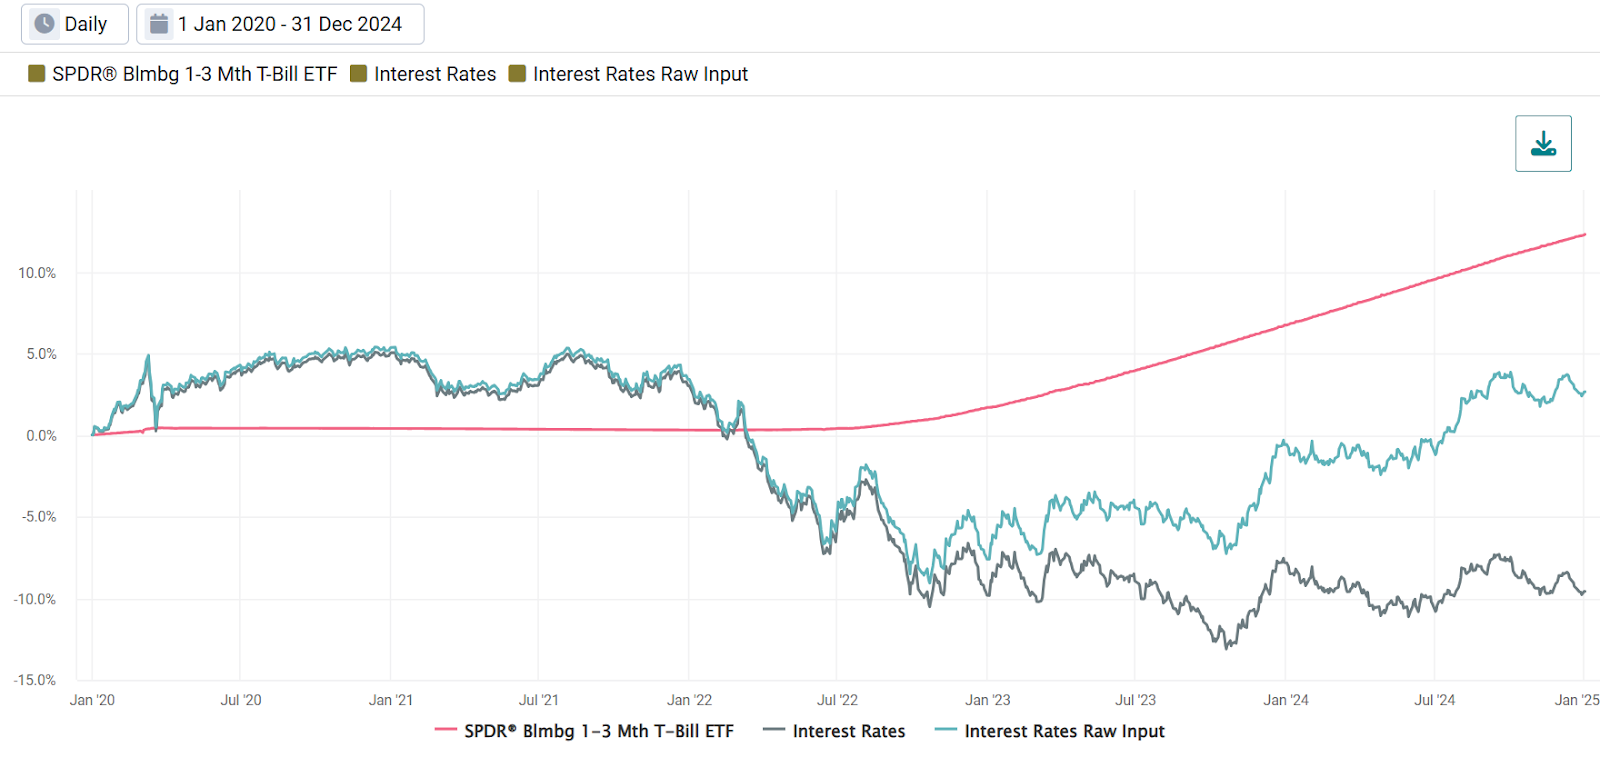
Similar to how our Equity Factor represents exposure to the equity risk premium, our Interest Rates factor captures exposure to the term risk premium, with the U.S. serving as the global risk-free rate. It has become increasingly important to isolate factor returns above the risk-free rate since the U.S. Fed began raising rates (and cash yield along with it) in 2022.
Exhibit 11: Interest Rates Raw Input and Factor Cumulative Return, Trailing 5-Years
Source: Venn by Two Sigma.
- Using 1-3-month T-bills as a proxy, the risk-free rate returned about 5.2% in 2024, posing a challenge for 7-10 year sovereign bonds to beat.
- This led to our factor being negative in 2024 despite positive performance of the raw input of around 3%.
- Although 7-10 year bonds were positive with inflation subsiding, this Interest Rate risk was not rewarded above the risk-free rate.
On to 2025
We will continue to share factor performance reports at the start of each month, along with other interesting content. Please subscribe if you’d like to keep our blogs on your radar. Happy New Year from the Venn team!
APPENDIX:
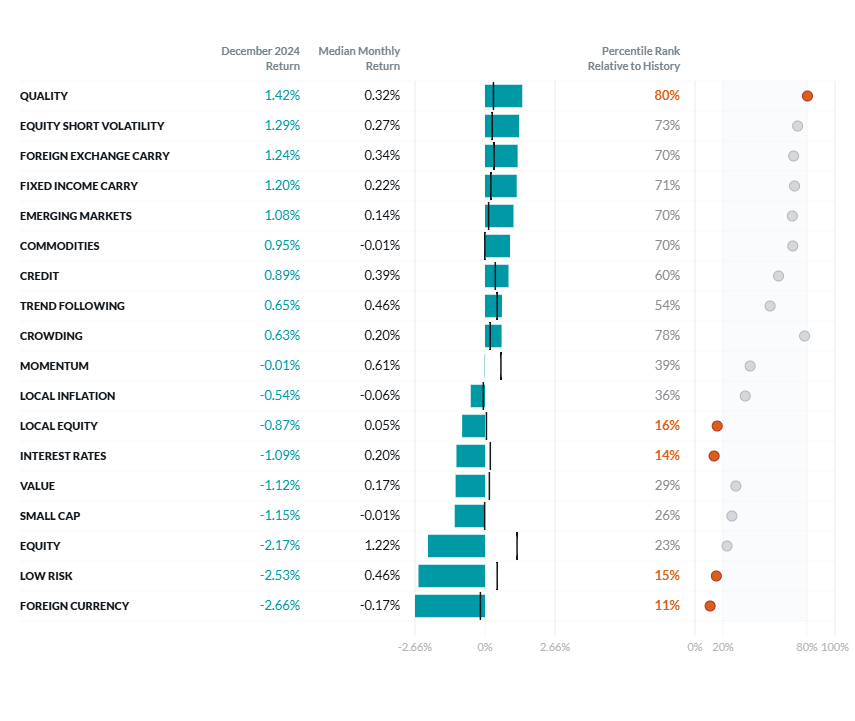
Two Sigma Factor Lens December Performance
©2024 Two Sigma Investments, LP. This image is for informational purposes only. See https://www.venn.twosigma.com/blog-disclaimer for more disclaimers and disclosures.
Source: Venn by Two Sigma. The median and percentile columns measure the performance of each factor in the Two Sigma Factor Lens relative to the entire history of the factor in USD, using monthly data for the period Oct 1997 - December 2024
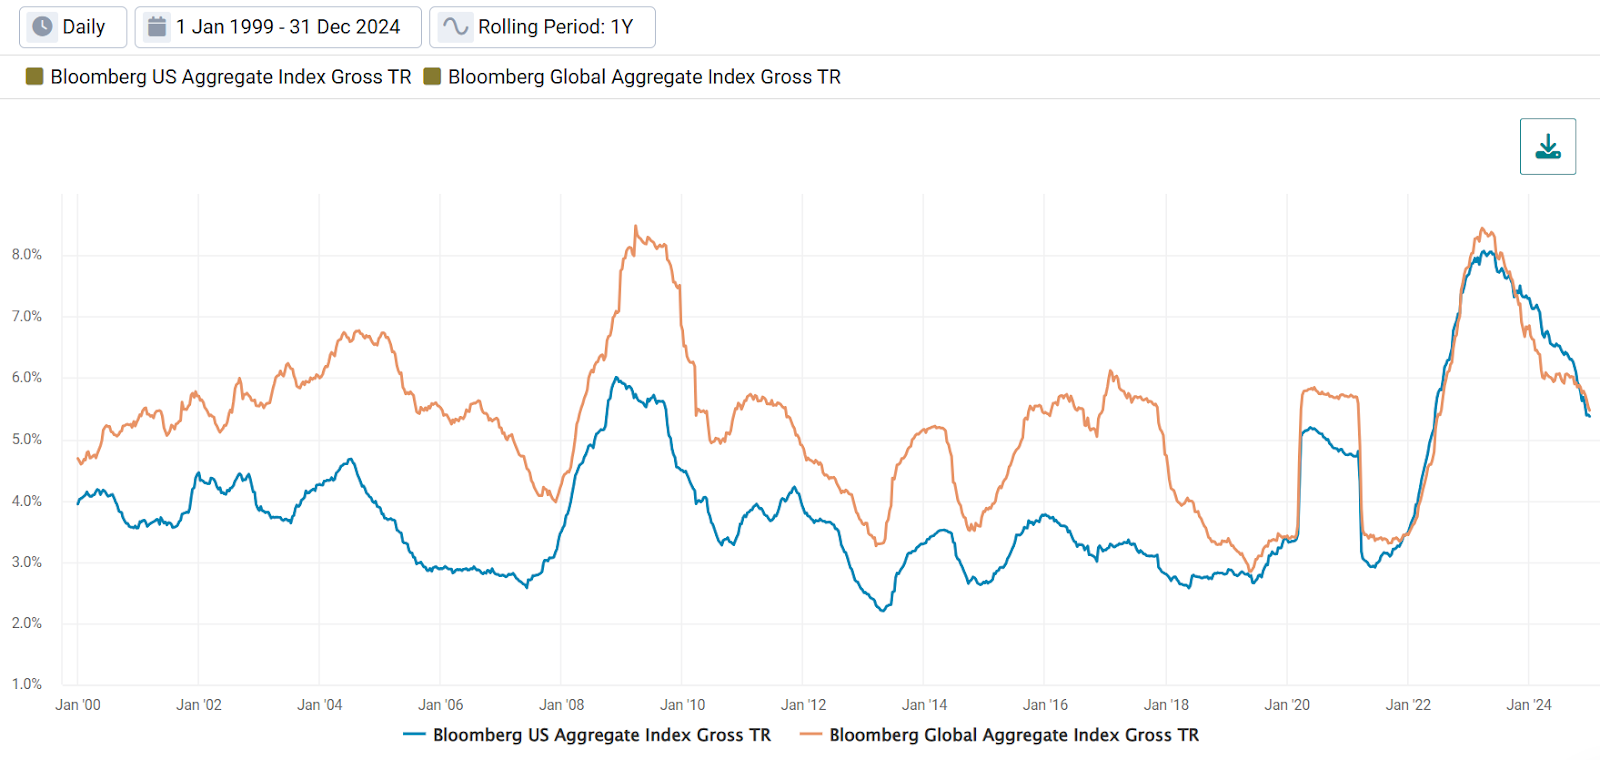
Rolling 1-Year Volatility of The Bloomberg US and Global Aggregate Indexes
Source: Bloomberg
References
1 Crowding is the exception as it only contains U.S. listed securities
2 To be more specific, they were -0.46 correlated in 2024. Their long-term correlation back to 1998 is virtually zero at -0.06.
3 Source: Bloomberg. Represented by MSCI Korea Index.
4 https://www.chosun.com/english/market-money-en/2024/08/05/VSTCQ64V6VFFZNQ73KB7E5LDQI/
5 https://www.chosun.com/english/market-money-en/2024/09/05/N32TEHN7DZHFVE6VTYWOYSTSWY/
6 https://finance.yahoo.com/news/jeju-air-stock-hits-record-035744719.html
7For example, historically (1/1/1999–12/31/2024) the Bloomberg Global Aggregate has had higher 1-year rolling volatility than the Bloomberg US Aggregate (see appendix). However, beginning around the start of 2022, when the Fed began raising rates, they have had much more similar rolling 1-year volatility with the Global Aggregate being lower at some points throughout 2024. Source: Bloomberg.
References to the Two Sigma Factor Lens and other Venn methodologies are qualified in their entirety by the applicable documentation on Venn.
This article is not an endorsement by Two Sigma Investor Solutions, LP or any of its affiliates (collectively, “Two Sigma”) of the topics discussed. The views expressed above reflect those of the authors and are not necessarily the views of Two Sigma. This article (i) is only for informational and educational purposes, (ii) is not intended to provide, and should not be relied upon, for investment, accounting, legal or tax advice, and (iii) is not a recommendation as to any portfolio, allocation, strategy or investment. This article is not an offer to sell or the solicitation of an offer to buy any securities or other instruments. This article is current as of the date of issuance (or any earlier date as referenced herein) and is subject to change without notice. The analytics or other services available on Venn change frequently and the content of this article should be expected to become outdated and less accurate over time. Two Sigma has no obligation to update the article nor does Two Sigma make any express or implied warranties or representations as to its completeness or accuracy. This material uses some trademarks owned by entities other than Two Sigma purely for identification and comment as fair nominative use. That use does not imply any association with or endorsement of the other company by Two Sigma, or vice versa. See the end of the document for other important disclaimers and disclosures. Click here for other important disclaimers and disclosures.


